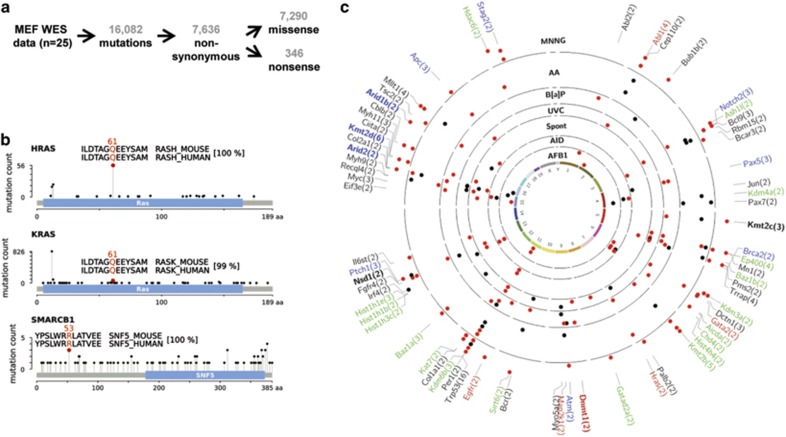
Figure 2.
Global mutation analysis. (a) Overview of WES results from 25 MEF BBCE cell lines. (b) Mutations, found in MEF BBCE cell lines, which were previously identified in tumors. Plots, showing mutations in HRAS, KRAS and SMARCB1 based on TCGA data, were generated using cBioPortal.52, 53 The mutated residue in MEFs is highlighted by a red circle. Alignment of human and mouse protein sequence around the mutated residue is shown in the inset, the mutated codon is indicated above the alignment. The overall similarity of human and mouse protein sequence is indicated in square brackets. (c) Recurrently mutated cancer and epigenetic modifier genes in the MEF BBCE cell lines. Genes listed in the Cancer Gene Census (black,20), oncogenes (red) and tumor suppressor genes (blue) by Vogelstein et al.,4 and epigenetic modifiers (green,34 modified) are indicated. Epigenetic modifiers that are also listed in the Cancer Gene Census are indicated in bold black. Epigenetic modifiers that are also listed as tumor suppressor genes by Vogelstein et al.4 are in bold blue. Epigenetic modifiers that are also listed as oncogenes by Vogelstein et al.4 are in bold red. Cell lines are arranged in concentric circles and grouped by carcinogen exposure (labelled in bold black font). Red and black dots represent exposure-predominant and exposure non-predominant mutation types, respectively.

