Figure 2.
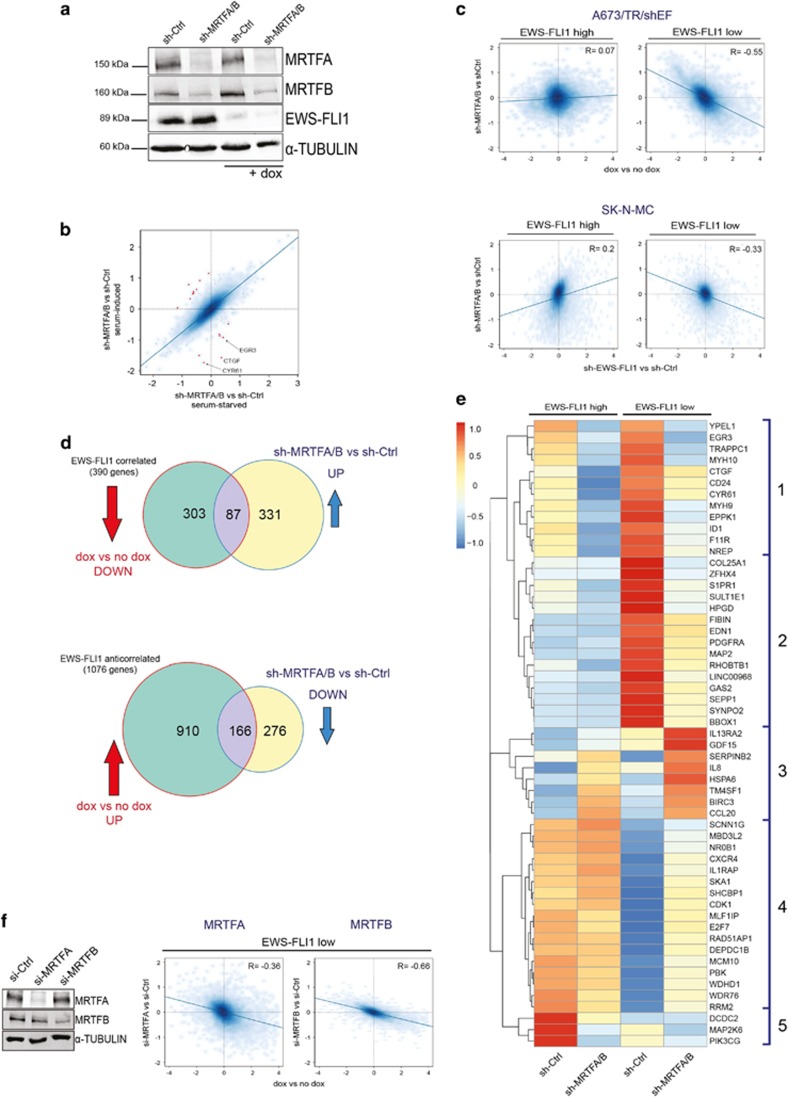
MRTFB knockdown antagonizes the transcriptional effects of EWS-FLI1 depletion. (a) Immunoblot of MRTFA and MRTFB knockdown by transient short hairpin RNA (shRNA) transfection with and without concomitant dox-induced (48 h) EWS-FLI1 silencing. Alpha-TUBULIN was used as a loading control. (b) Scatter plot showing effects of serum on MRTFA/B-dependent gene regulation. x axis: sh-MRTFA/B versus sh-Ctrl under starved conditions. y axis: sh-MRTFA/B versus sh-Ctrl under serum-induced conditions. Red dots indicate serum-responsive MRTFA/B-regulated genes at |logFC|⩾0.8 with some examples given. (c) Comparison of effects of MRTFA/B knockdown versus EWS-FLI1 knockdown in A673/TR/shEF and SK-N-MC. Scatter plots showing log2 fold gene expression changes upon EWS-FLI1 knockdown (x axis; dox versus no dox), and upon MRTFA/B knockdown (y axis; sh-MRTFA/B versus sh-Ctrl) alone (EWS-FLI1-high) or in combination with EWS-FLI1 knockdown (EWS-FLI1-low) in A673/TR/shEF (upper panel) and SK-N-MC cell line (lower panel). (d) Inverse gene regulation by MRTFA/B and EWS-FLI1. Venn diagrams of EWS-FLI1-correlated and -anticorrelated genes (green circles) and MRTFA/B-regulated genes under EWS-FLI1-low conditions (yellow circles) in A673/TR/shEF cells. Overlapping area indicates the number of genes that are partially rescued from EWS-FLI1 knockdown effects by MRTFA/B depletion. Arrows indicate direction of gene expression change for EWS-FLI1 knockdown (dox versus no dox; red, |logFC|⩾1, P<0.05), and for combined EWS-FLI1/MRTFA/B knockdown (sh-MRTFA/B versus sh-Ctrl under dox; blue, |logFC|⩾0.7, P<0.05). (e) Heatmap and unsupervised hierarchical clustering of gene expression changes induced by MRTFA/B knockdown under EWS-FLI1-high and -low conditions (cutoff: |logFC|⩾1.5; P<0.05) from two independent experiments. (f) Gene expression effects of specific short interfering RNA (siRNA)-mediated depletion of either MRTFA or MRTFB. Left: representative immunoblot showing the individual siRNA-mediated knockdown of MRTFA and MRTFB on protein level. Right: scatter plots of gene expression (log2 fold) changes induced by EWS-FLI1 (x axis) versus combined MRTFA/B+EWS-FLI1 (y axis) silencing. The inverse correlation is higher for MRTFB (R=−0.66) than for MRTFA (R=−0.36).

