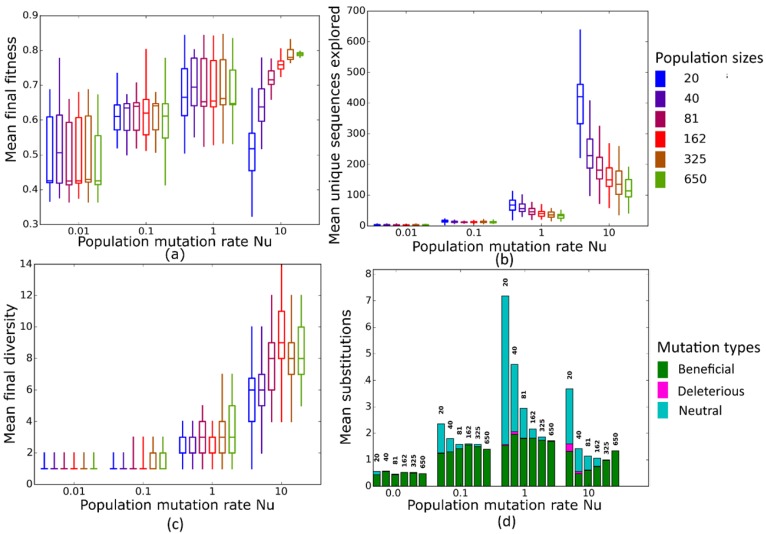
Figure 4.
Simulated evolution of sequences with secondary structure 1 (Str1, Table 1) at varying population mutation rates Nµ and population sizes. We randomly-selected a low-fitness sequence to initialize each simulation, and then simulated 800 generations of mutation and selection. We performed 50 replicate simulations for each mutation rate (horizontal axes) and population size (see Methods). Boxplots show (a) final mean population fitness, (b) total unique sequences explored, and (c) final population diversity (number of unique sequences at generation 800). Each box encloses the second and third quartiles of the 50 replicates, the center line corresponds to the median, and the whiskers depict the minimum and maximum values obtained from any replicate, excluding the outliers. (d) Mean numbers of unique beneficial, deleterious, and neutral substitutions (green, pink, and cyan) are summarized as bars for the 50 replicates at each mutation rate (horizontal axis) and population size (labels above bars).

