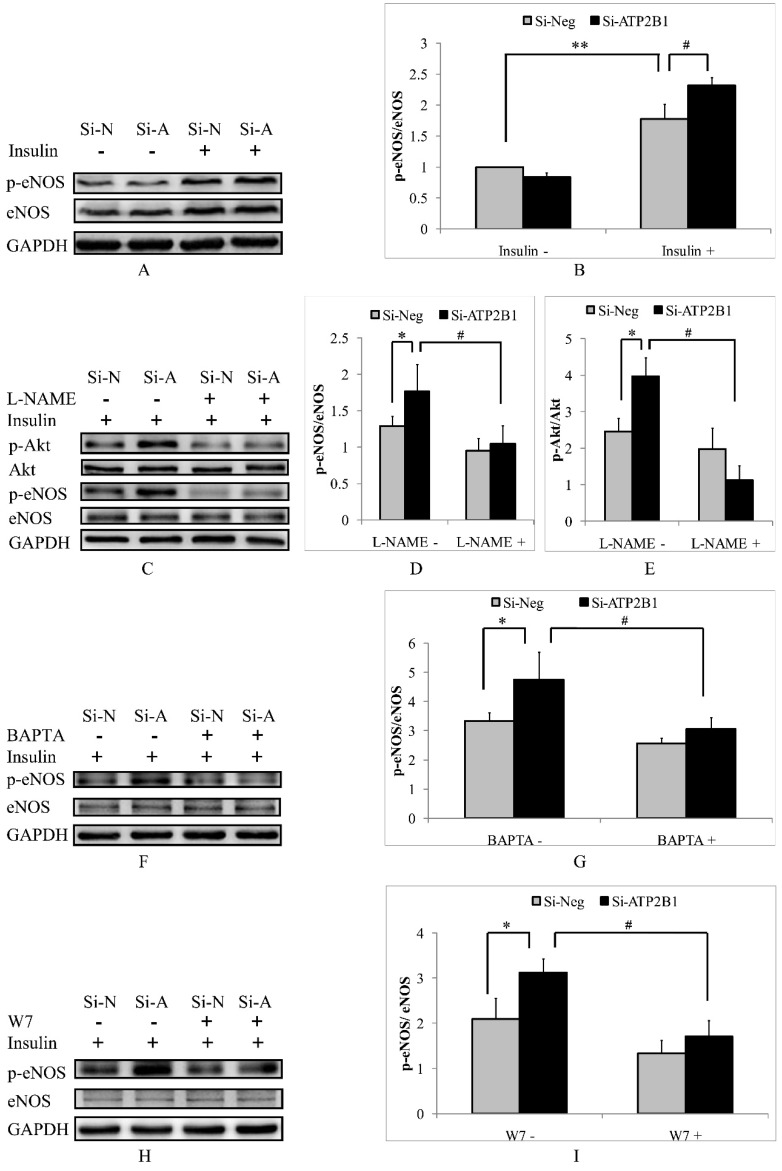
Figure 4.
Increased insulin sensitivity in ATP2B1-silenced HUVECs is dependent on the calcium-calmodulin-eNOS signaling pathway. HUVECs were stimulated with 100 nM insulin after overnight serum starvation. A. Representative Western blotting results of p-eNOS, eNOS and GAPDH (n=4). B. Fold changes of phosphor-eNOS vs. total eNOS relative to its basal levels in control cells were quantified by densitometry. HUVECs were treated with L-NAME for 2 hours before they were stimulated with insulin. ** 0.05<P<0.001, vs. negative siRNA-transfected cells without insulin stimulation. #P<0.05, vs. cells transfected with negative siRNA. C. Representative Western blotting results of p-Akt, Akt, p-eNOS, eNOS and GAPDH (n=3). Fold changes of phosphor-eNOS vs. total eNOS (D) and phosphor-Akt vs. total Akt (E) relative to the basal levels in control cells were quantified by densitometry. * P<0.05, vs. negative siRNA-transfected cells. #P<0.05, vs. si-Neg cells precultured without L-NAME. HUVECs were stimulated with 100 nM insulin after being treated with BAPTA or W7 for 2 hours. Representative Western blotting of p-eNOS, eNOS and GAPDH in cells pretreated with BATPA (F) or W7 (H) (n=3). Fold changes of phosphor-eNOS vs. total eNOS in cells cultured with BATPA (G) or W7 (I) were quantified by densitometry. * P<0.05, vs. negative siRNA-transfected cells. #P<0.05, vs. si-Neg cells without BAPTA-AM or W7 pretreatment.

