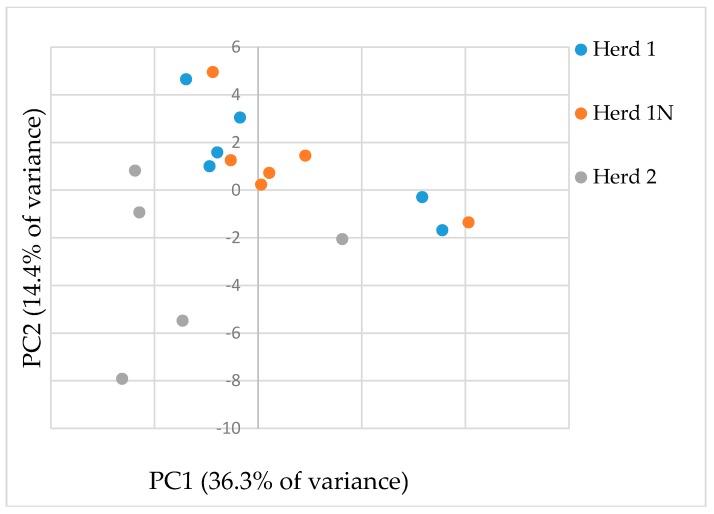
Figure 1.
Principal component analysis (PCA) score plots of PC1 versus PC2 from target metabolite profiles of urinary samples derived from three groups of cattle. Herd 1: known to have persistently high urinary ZEN and STC concentrations due to contaminated rice straw, Herd 1N: urine samples were collected from Herd 1, 2 weeks after replacing the newly not-contaminated rice straw, Herd 2: same feeding pattern as Herd 1, except for the contaminated rice straw. The percentages shown on the x- and y-axes represent the contribution to PC1 and PC2, respectively.

