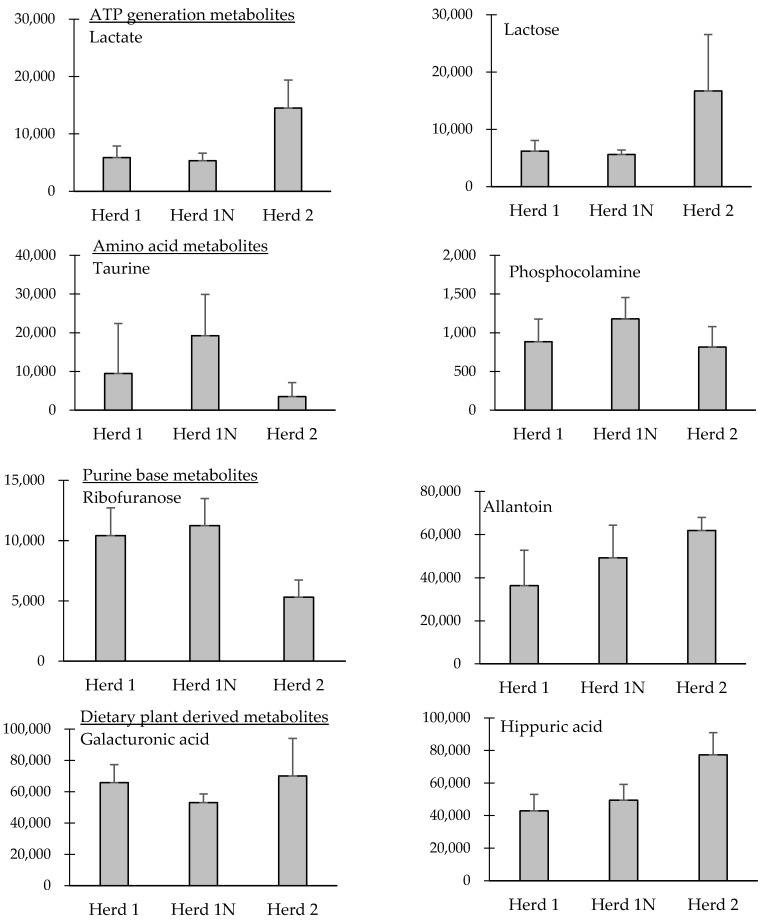
Figure 2.
Differences in each representative metabolite among the three herds, which were identified as significantly different by ANOVA (p < 0.05). Values on the y-axis were normalized to the peak area on the gas chromatography/mass spectroscopy chromatogram by the peak area of internal standard and then normalized by the measured values of urinary creatinine in individual cattle.

