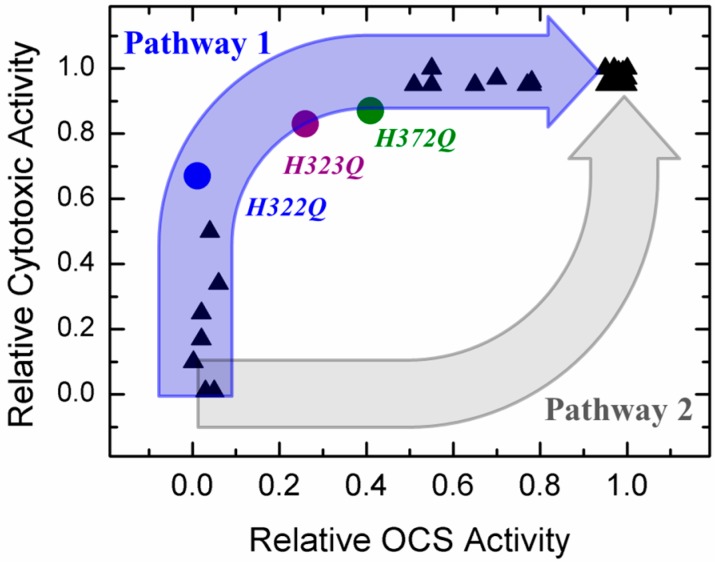
Figure 5.
Comparison of the relative cellular toxicity in various mutants of diphtheria toxin and relative OCS activity of the T-domain with the same mutations in planar bilayers. Black triangle represents a single set of activity measurements (protein synthesis inhibition in living cells and conductance in planar bilayers) for a mutant reported in references [37,46,48]. The data for H322Q, H323Q, and H372Q mutants (color-coded circles) are from Figure 4b and reference [38]. Blue and gray arrows indicate the expected correlation for the translocation occurring via Pathway 1 or 2, respectively (see Figure 1 and text for details).

