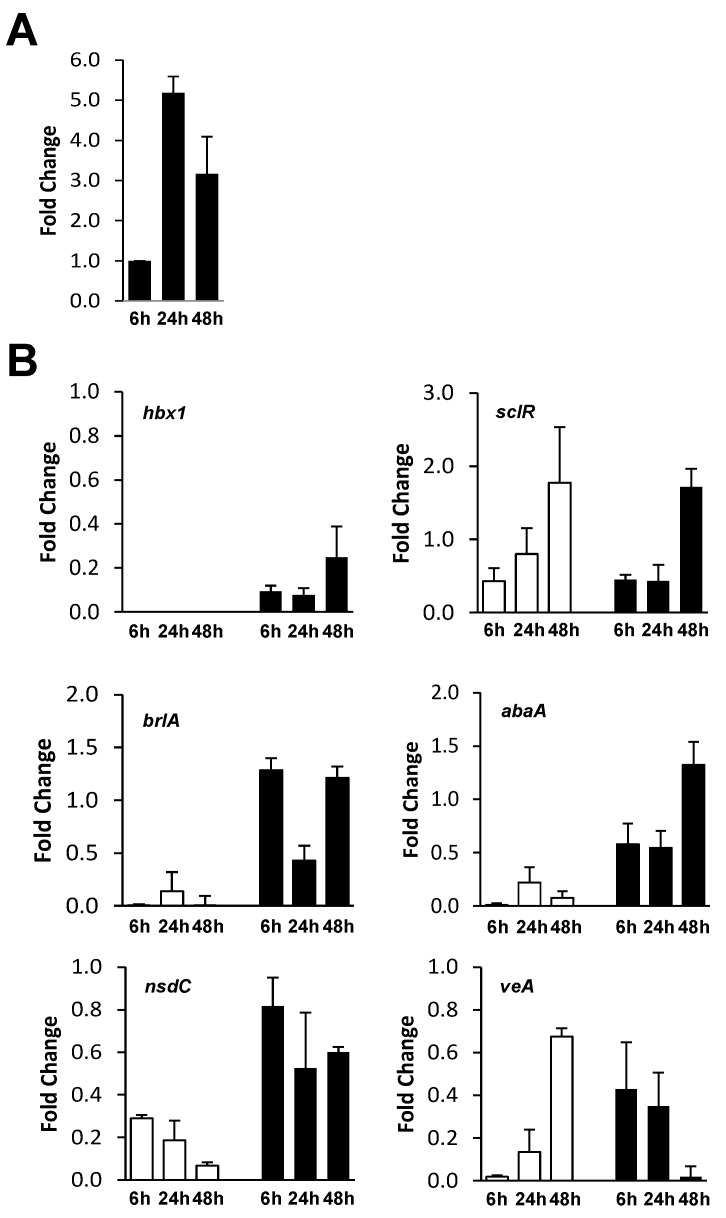
Figure 6.
Analysis of hbx1 and developmental gene expression in AF70 strains. (A) RT-qPCR of hbx1 expression in the AF70 pyrG-1 control strain at 6, 24 and 48 h time points. (B) Analysis of hbx1 and developmental gene expression in the AF70 Δhbx1 #4 (white bars) and Δhbx1-com #8 strains (black bars). Expression is relative to a level of 1 set for the AF70 control. Cultures were grown and samples prepared as described in Materials and Methods. The relative gene expression levels for all time points were normalized to the A. flavus 18S rRNA CT values as part of the ΔΔCT analysis method. A Fold-Change formula (2−ΔΔCT) [44] was used in the conversion of the ΔΔCT results for a final calculation of values.

