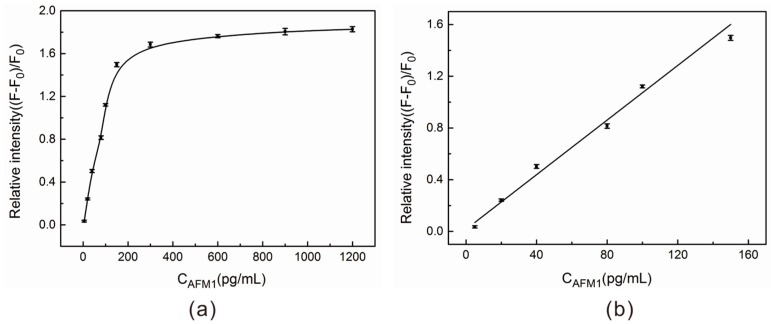
Figure 3.
(a) The fluorescence recovery trend line in accordance with different concentrations of AFM1 (5, 20, 40, 80, 100, 150, 300, 600, 900, 1200 pg/mL). F0 represents the fluorescence intensity in the absence of AFM1. (b) The linear relationship between the fluorescence recovery degree (at 520 nm) and the concentration of AFM1 within the range from 5 pg/mL to 150 pg/mL, data were presented as average ± SD from three independent measurements. Experiments were conducted in the presence of 80 nM 5′-FAM-labeled AFM1 aptamer and 0.060 mg/mL PdNPs in HEPES buffer under excitation at 480 nm.

