Figure 5.
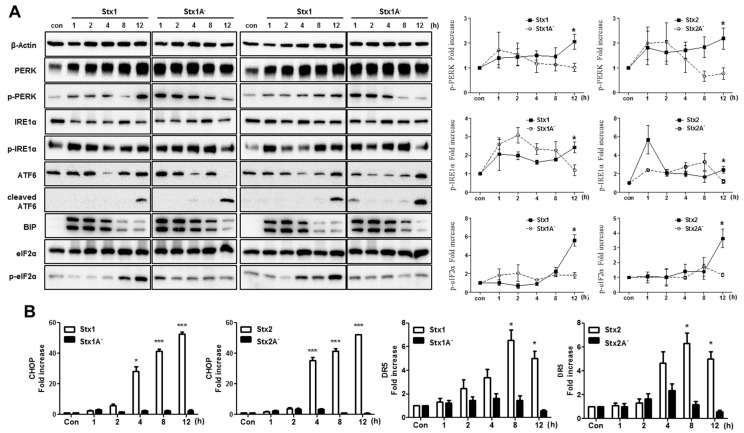
The ER stress response is induced in RPE cells after Stx1 or Stx2 exposure. (A) ARPE-19 cells (5.0 × 10⁵ cells/well) were stimulated with Stx1 (100 ng/mL), Stx1A− (100 ng/mL), Stx2 (10 ng/mL) or Stx2A− (10 ng/mL). At the indicated times (h), cells were lysed and the presence of activated ER stress sensors and their downstream targets in cellular lysates were determined by Western blotting. Untreated control cells (con) were used to determine baseline protein expression. β-Actin was used as a control for equal protein loading. The line graphs show the mean ± SEM of band densities normalized by the division of β-Actin band densities and compared to untreated control cell values (right panel). Statistical analyses of densitometric scans from at least three independent experiments are shown; (B) ARPE-19 cells were treated as outlined above and CHOP and DR5 mRNA expression were measured using RT-PCR and normalized using Glyceraldehyde 3-phosphate dehydrogenase (GAPDH). The data are expressed as mean and SEM increases in (A right panel) phospho-PERK (p-PERK), phospho-IRE1α (p-IRE1α), phospho-eIF2α (p-eIF2α), and (B) CHOP and DR5 mRNA levels compared to the levels in untreated control cells. Asterisks indicate significant differences between Stx1 and 2 vs. Stx1A− and 2A−; * = p < 0.05; *** = p < 0.001.

