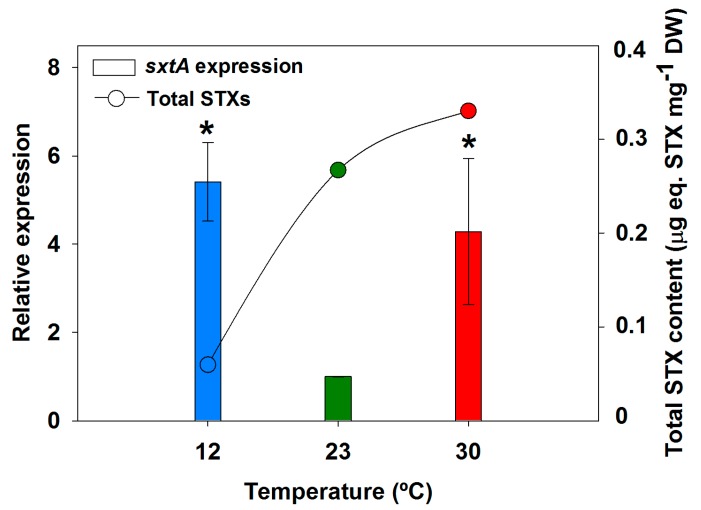
Figure 3.
Relationship between total STX content and sxtA gene expression in Aphanizomenon gracile UAM529 after 8 days of growth. Vertical bars show relative expression values respective to 23 °C, which was set to 1 to facilitate comparison. Asterisks indicate significant differences of relative expression with 23 °C (p < 0.05; one-way ANOVA and Holm-Sidak post hoc test).

