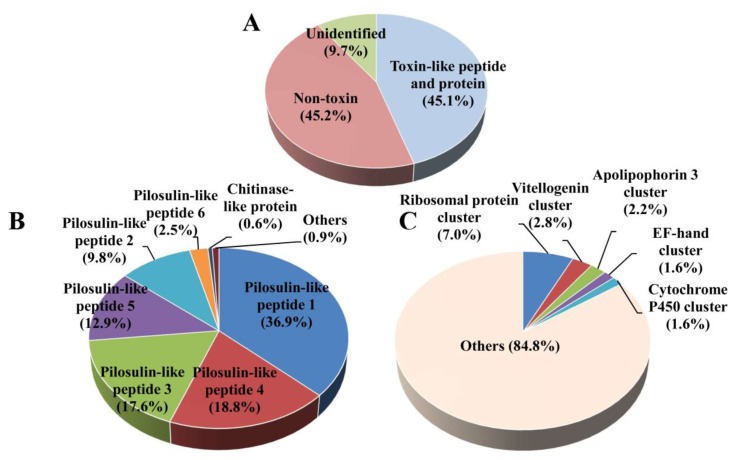
Figure 2.
The Odontomachus monticola venom gland gene expression profile. The relative expression levels of the genes encoding toxin-like peptides, proteins, non-toxins, and unidentified molecules are displayed as percentages of mapped reads in the total reads (A). The distribution of toxin-like peptide- and protein gene expressions (B) and non-toxin gene expressions (C) are shown. The relative expression levels of the genes are typically reported as RPKM (reads per kilobase of exon model per million mapped reads) in order to correct for the differences in length of individual transcripts. Nevertheless, transcript lengths may not, in fact, influence the expression levels, because those for the abundantly expressed toxin-like peptides and proteins were short.

