Figure 6.
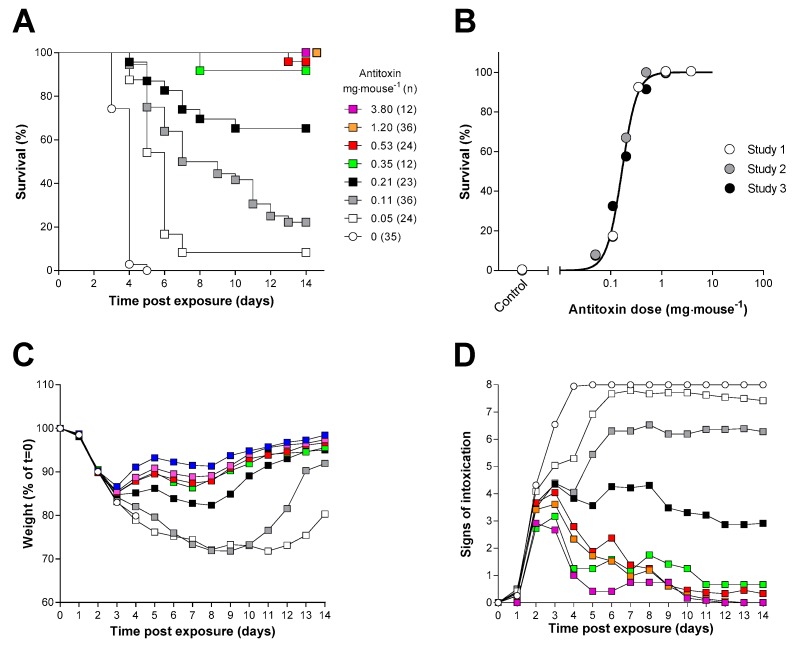
Characterisation of the dose–response of ovine F(ab’)2 in the mouse ricin inhalation model. (A) Kaplan–Meier plot of survival in mice administered ricin (3LCt50, 21.54 mg·min·m−3) and treated 20 h later with the indicated dose of antitoxin i.v. (the key in (A) also applies to (C,D)). Data have been combined from three independent experiments each of which used a group size of 12 mice. (B) Probit analysis of survival at 14 days, the curve was reconstructed from the output of the Minitab probit analysis which was fitted to the combined dataset. Data points are shown for survival at 14 days from three independent experiments. (C) Body weight; and (D) signs of intoxication following administration of ricin and the indicated amount of antitoxin are shown. Data are combined from three independent experiments. Error bars have been omitted for clarity; the SDs are generally <10% and <2 units, respectively, for n = 12–36 mice. Signs of intoxication were scored according to Table S1.

