Figure 2.

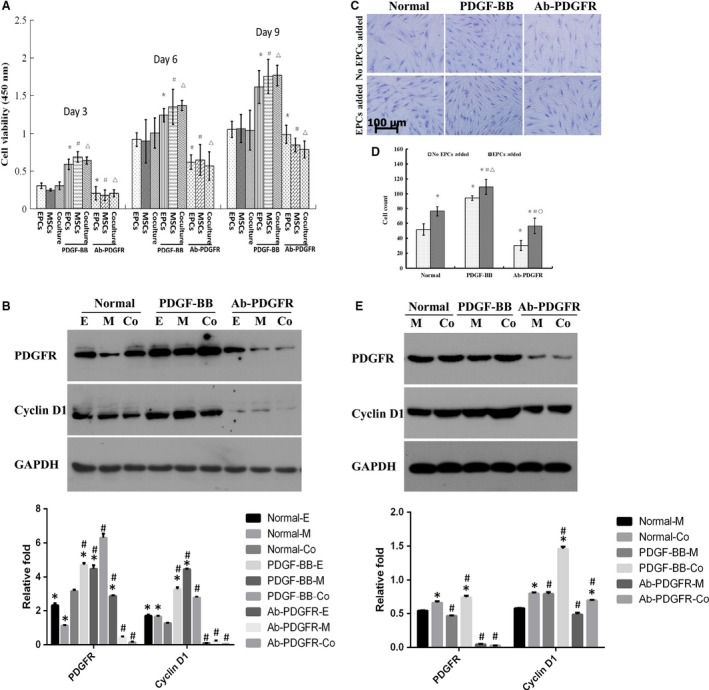
hEPCs coculture and PDGF‐BB enhanced proliferation of hMSCs. (A) Cell viability was determined in a 2D mixed monolayer coculture on Days 3, 6, and 9 as described in Materials and methods. n = 6 for each group, *P < 0.05, compared to hEPCs alone; # P < 0.05, compared to hMSCs alone; ▵ P < 0.05, compared to hEPCs+hMSCs; (B) protein expression levels of cyclin D1 and PDGFR in all groups on Day 6 were determined by western blot. *P < 0.05, compared to coculture group, # P < 0.05, compared to corresponding untreated control; (C) the proliferation of hMSCs on Day 6 in a 3D cell‐to‐cell coculture system, where the hEPCs were cultured on the opposite side of transwell membrane; (D) cell numbers were counted in six random fields (magnification 200×); *P < 0.05, compared to hEPCs alone; # P < 0.05, compared to hEPCs+hMSCs; ▵ P < 0.05, compared to hEPCs+PDGF‐BB; ○ P < 0.05, compared to hEPCs+AB‐PDGFR; (E) protein expression level of cyclin D1 and PDGFR in all groups on Day 6 was determined by western blot. *P < 0.05, compared to hMSCs alone, # P < 0.05, compared to corresponding untreated control.
