
Figure 1.
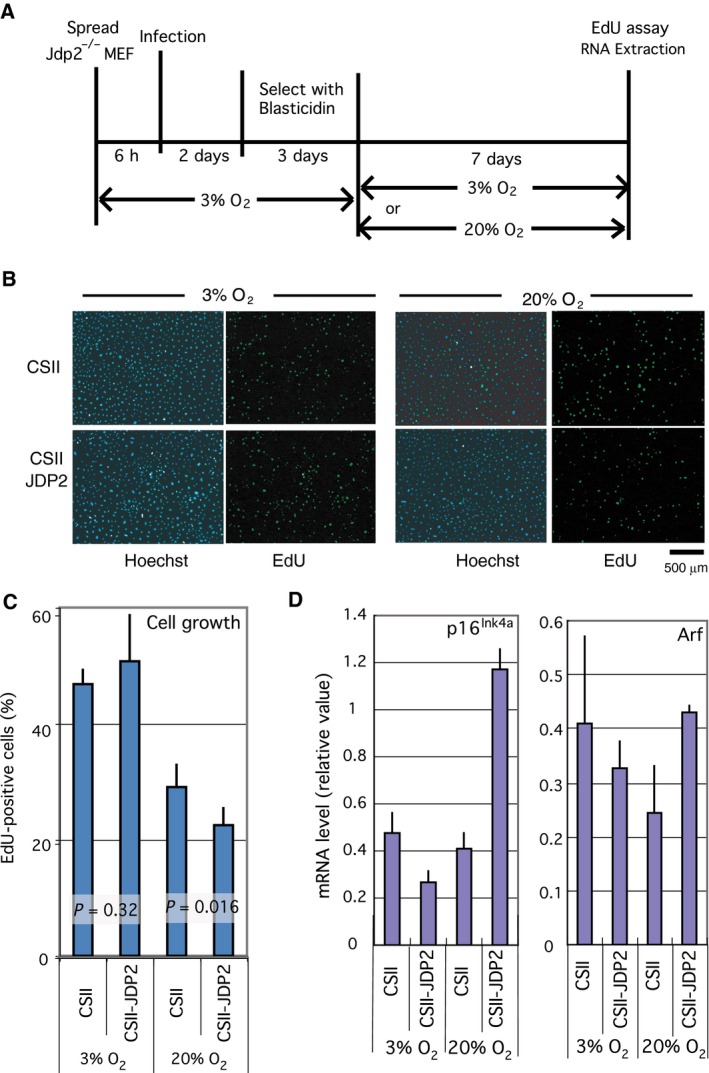
Inhibition of cell proliferation by JDP2 is oxidative stress dependent. (A) Schematic diagram showing the details of the assay conditions. Jdp2 −/− MEFs cultured in the low oxygen concentration (3% O2) were infected with a lentivirus expressing JDP2 (CSII‐JDP2) or the empty vector (CSII). The infected cells were selected using blasticidin in low oxygen concentration, then cultured in the environmental (20% O2) or low oxygen concentrations for 7 days. The proliferation rate was analyzed using a EdU incorporation assay. (B) Cell proliferation was assayed via EdU incorporation. Cells were cultured in the presence of EdU for 14 h. Whole cells and proliferating cells were stained with Hoechst 33342 dye (right panel) and a Click‐iT EdU Alexa Fluor Imaging Kit (left panel), respectively. We performed nine different experiments. Scale bar = 500 μm. (C) Rate of growing cells in the EdU incorporation assay. The number of EdU‐positive and Hoechst‐stained cells was counted, and the percentages of growing (EdU‐positive) cells and their P‐values were calculated. The data stemmed from more than five different images. The numbers of counted cells are shown in Table S1. (D) Expression of the mRNA for p16Ink4a (left) and Arf (right). Total RNA was extracted from cells cultured for 7 days in environmental (20% O2) or low oxygen (3% O2) concentrations. The mRNA levels were analyzed by real‐time RT‐PCR using specific primers. Error bars in each graph represent the SD of the data.