
Figure 4.
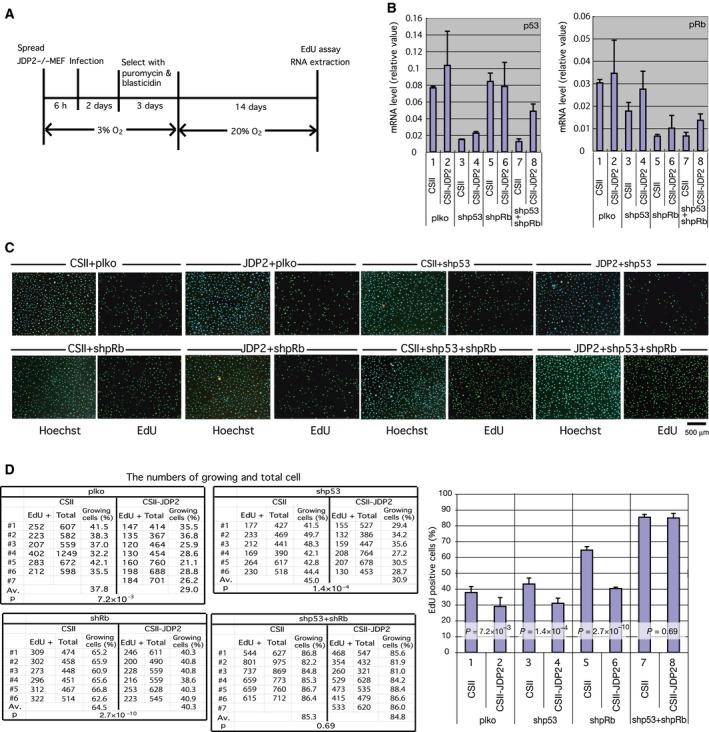
Inhibition of cell proliferation by JDP2 is dependent on both the p16Ink4a‐pRb and Arf‐p53 pathways. (A) Schematic diagram showing the details of assay conditions. Jdp2 −/− MEFs cultured in the low oxygen condition were coinfected with CSII (empty vector) or CSII‐JDP2 and plko (empty vector) or shpRb and/or shp53 (which express shRNA for pRb and p53, respectively). The infected cells were selected by blasticidin and puromycin in low oxygen for 3 days and were then cultured in the environmental oxygen condition (20% O2) for 14 days. The rate of cell proliferation was analyzed using EdU incorporation assay. (B) Expression of mRNA for p53 (left) and pRb (right). Total RNA was extracted from the cells at the same time for the cell proliferation assay. The mRNA levels were analyzed by real‐time RT‐PCR using specific primers. (C) Effect of JDP2 on cell proliferation in pRb and/or p53 downregulated MEFs. The cells were cultured in the presence of EdU for 14 h. Whole cells and proliferating cells were visualized using Hoechst 33342 and a Click‐iT EdU Alexa Fluor Imaging Kit, respectively. We performed at least seven experiments. Scale bar = 500 μm. (D) The number of whole (Hoechst 33342‐stained) cells and growing (EdU‐positive) cells were counted. The percentage of growing cells against whole cells and their P‐values were calculated. The data were derived from at least six different images. The numbers of counted cells are shown in Table S1. Error bars in each graph represent the SD of the data.