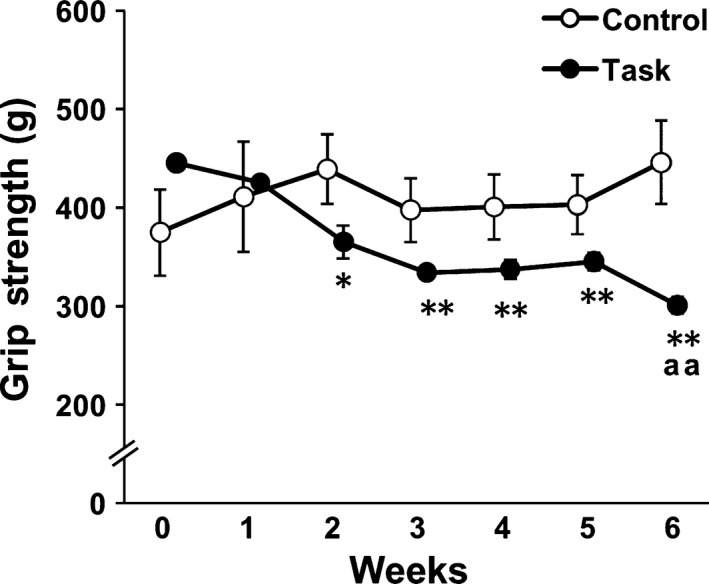
Figure 3.

Changes in grip strength. Data are means ± SEM. *P < 0.05, **P < 0.01, compared with week 0. aa P < 0.01, compared with time‐matched rats from the Control group (n = 6 per group).

Changes in grip strength. Data are means ± SEM. *P < 0.05, **P < 0.01, compared with week 0. aa P < 0.01, compared with time‐matched rats from the Control group (n = 6 per group).