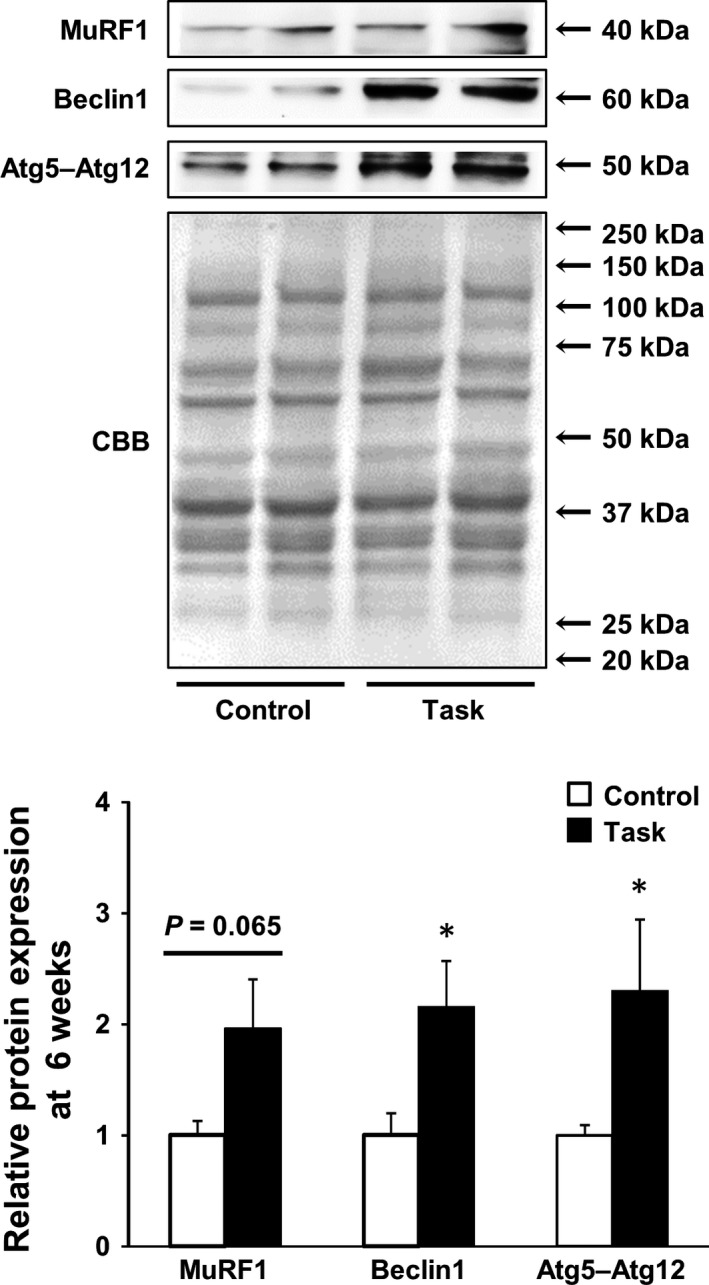
Figure 9.

Levels of MuRF1, Beclin1, and Atg 5–Atg12 proteins in FDS muscles at 6 weeks. Representative blots depicting MuRF1, Beclin1, and Atg5–Atg12 are shown. Quantitative analysis is shown in the lower panel. Results are reported as fold changes with respect to control levels, which were arbitrarily set to 1. Data are means ± SEM. *P < 0.05, compared with time‐matched rats in Control group (n = 6 per group).
