Figure 5.
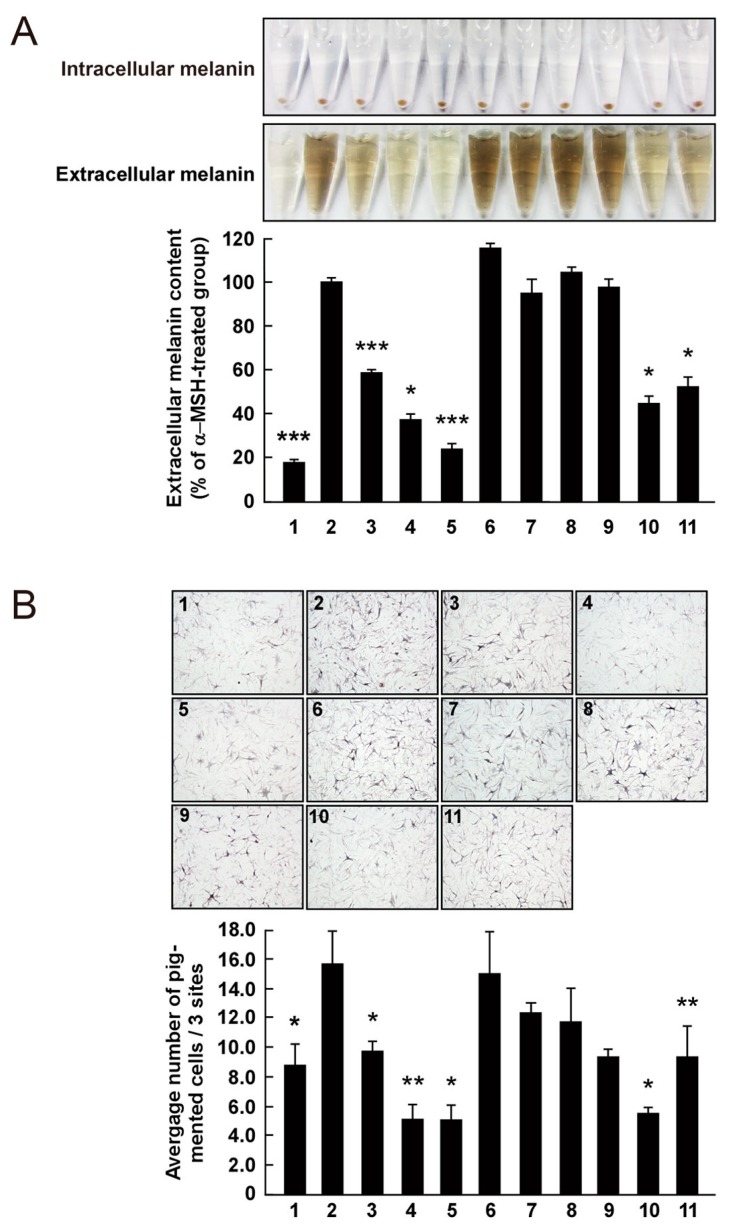
Effect of 3,6-anhydro-l-galactose (AHG) and AHG-containing agarooligosaccharides (AOSs) and neoagarooligosaccharides (NAOSs) on melanogenesis in (A) murine B16 melanoma (B16F10) cells and (B) human epidermal melanocytes (HEMs). (A) AHG and NAOSs inhibited α-melanocyte-stimulating hormone (α-MSH)-induced melanin production in B16F10 cells, but AOSs did not. B16F10 cells were pretreated with each sugar sample for 1 h before exposing to α-MSH (100 nM). Three days later, a melanin content was assayed, as described in the Experimental Section. 1, untreated control cells; 2, α-MSH; 3, α-MSH and 25 μg/mL arbutin; 4, α-MSH and 50 μg/mL arbutin; 5, α-MSH and 50 μg/mL AHG; 6, α-MSH and 50 μg/mL agarotriose (DP3); 7, α-MSH and 50 μg/mL agaropentaose (DP5); 8, α-MSH and 50 μg/mL agaroheptaose (DP7); 9, α-MSH and 50 μg/mL neoagarobiose (NeoDP2); 10, α-MSH and 50 μg/mL neoagarotetraose (NeoDP4); and 11, α-MSH and 50 μg/mL neoagarohexaose (NeoDP6). All photographs were taken at the same magnification using a digital camera. The melanin level in the culture medium was analyzed by measuring the absorbance at 495 nm. Data are presented as the means ± SD of three independent determinations. Asterisks indicate a significant difference (*, p < 0.05; ***, p < 0.001) compared with the α-MSH-treated group. (B) AHG and NAOSs inhibited α-MSH-induced melanin production in HEMs, but AOSs did not. HEMs were pretreated with each sugar sample for 1 h before being exposed to α-MSH (100 nM). Three days later, Fontana-Masson staining was performed to visualize pigmented melanocytes, as described in the Experimental Section. 1, Untreated control cells; 2, α-MSH; 3, α-MSH and 25 μg/mL arbutin; 4, α-MSH and 50 μg/mL arbutin; 5, α-MSH and 50 μg/mL AHG; 6, α-MSH and 50 μg/mL DP3; 7, α-MSH and 50 μg/mL DP5; 8, α-MSH and 50 μg/mL DP7; 9, α-MSH and 50 μg/mL NeoDP2; 10, α-MSH and 50 μg/mL NeoDP4; and 11, α-MSH and 50 μg/mL NeoDP6. All photographs were taken at the same magnification. Pictures are representative of three independent experiments that gave similar results. Pigmented melanocytes were enumerated at three randomly selected sites under a microscope at 400× magnification and are expressed relative to the untreated control. Data are presented as the means ± SD of three independent experiments. Asterisks indicate a significant difference (*, p < 0.05; **, p < 0.01) compared with the α-MSH-treated group.

