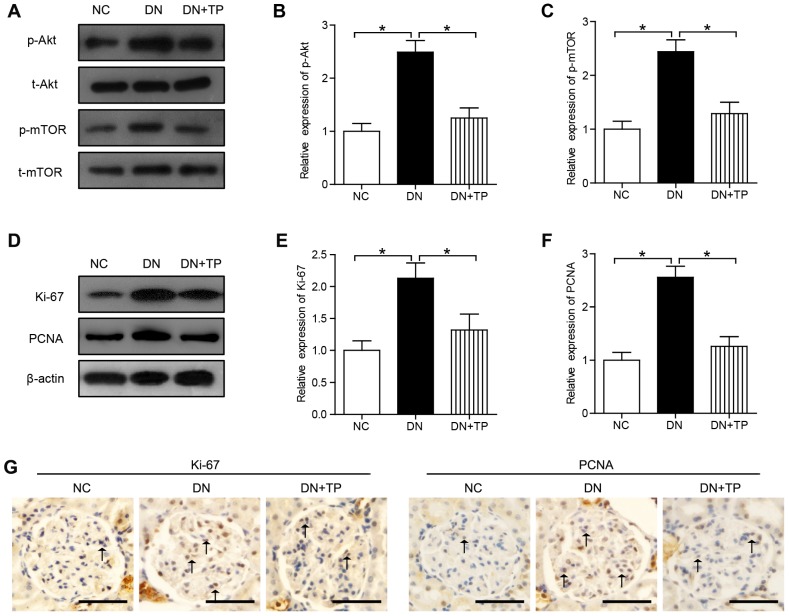
Figure 2.
Cell proliferation in the kidney of HFD/STZ-induced diabetic rats. (A) Protein expression of Akt/mTOR signal pathway in the kidneys of rats. (B and C) Quantification of results in A. (D) Protein expression of Ki-67 and PCNA in the kidneys of rats. (E and F) Quantification of results in D. (G) Immunohistochemistry images of Ki-67 and PCNA. The scale bar represents 50 μm. Data were reported as mean ± S.D.. *P < 0.05

