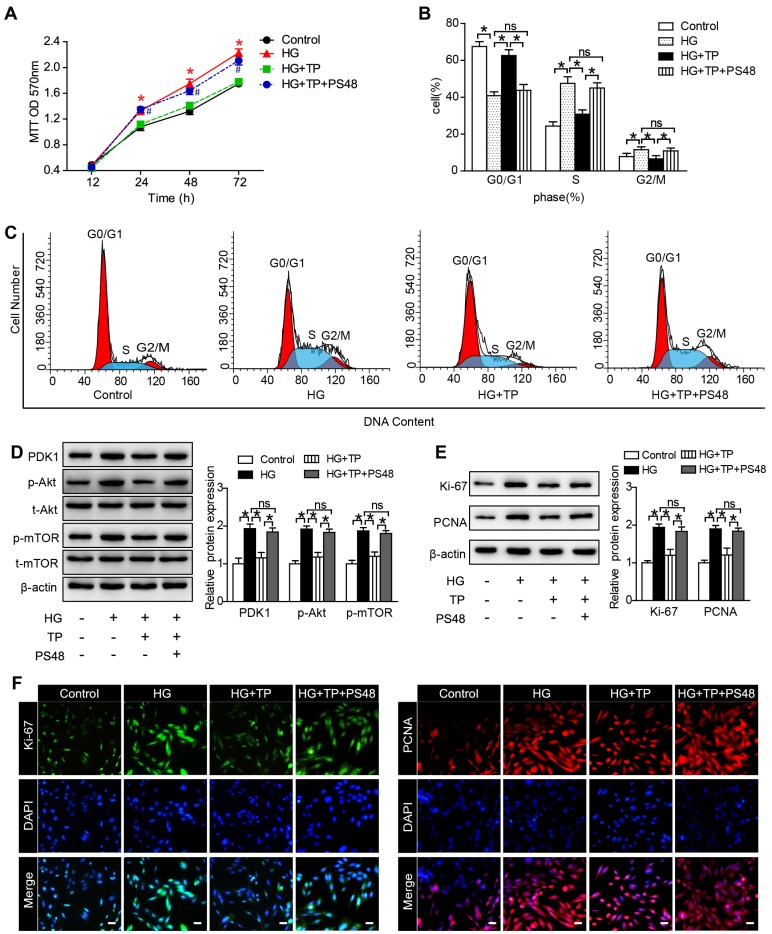
Figure 6.
PDK1 activator reversed the effect of TP on mesangial cell proliferation. (A) MTT assay in the cells treated with HG for different times. *P < 0.05 vs. Control group, #P < 0.05 vs. HG+TP group. (B and C) Flow cytometry analysis of cell cycle in the HRMCs treated for 72 h. (D) Protein expression of PDK1/Akt/mTOR pathway in HRMCs treated for 72 h. (E) Protein expression of Ki-67 and PCNA in HRMCs treated for 72 h. (F) Immunofluorescence images of Ki-67 and PCNA. The scale bar represents 10 μm. Data were reported as mean ± S.D.. *P < 0.05; ns represents no significance

