Figure 1.
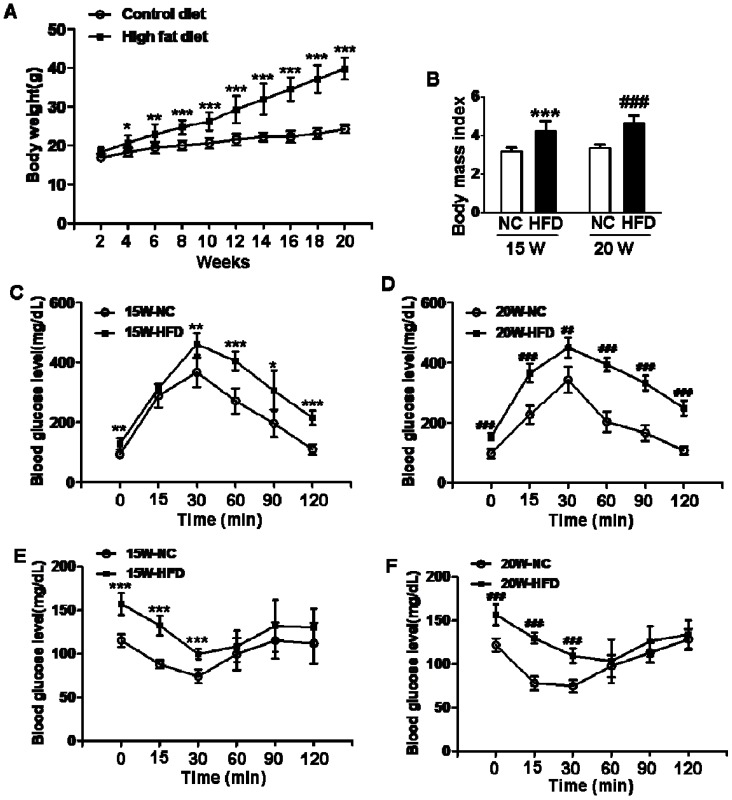
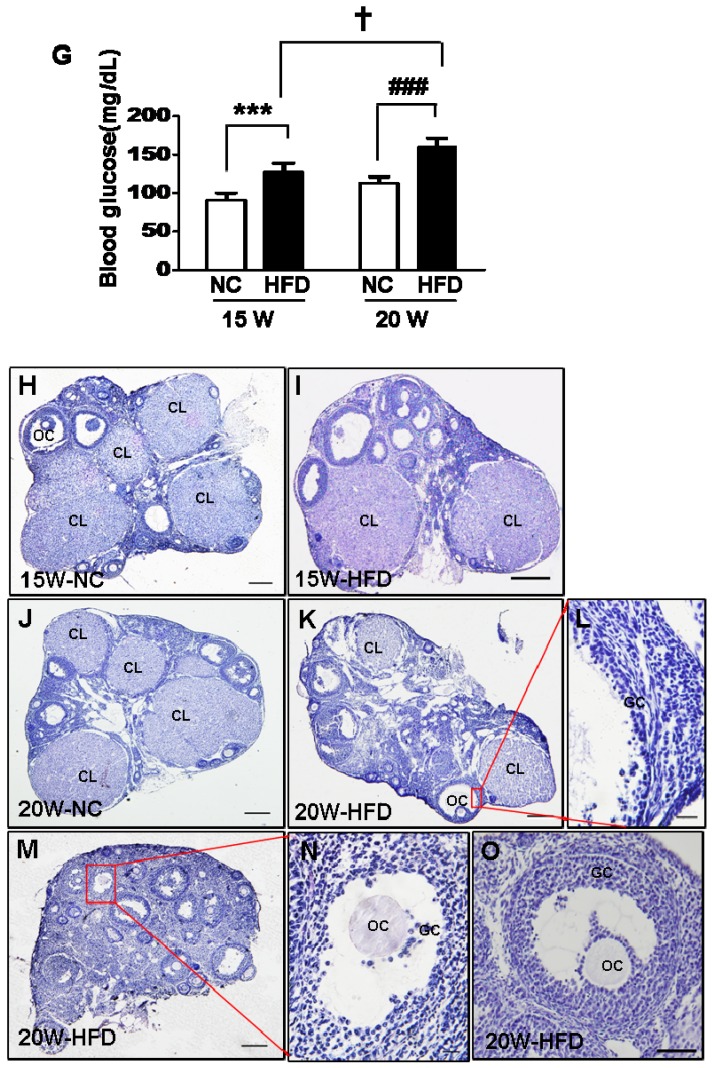
Diet induced-obese (DIO) type 2 diabetes caused abnormal ovarian follicular development. (A) Body weight of mice during fed with different diet (n=8); (B) Body mass index (BMI) of mice after 15/20 weeks fed with normal diet and HFD (n=8); Blood glucose level during GTT after 15 weeks(C) and 20 weeks(D) fed with different diet(n=6); Blood glucose level during ITT after 15 weeks(E) and 20 weeks(F) fed with different diet (n=6). (G) Blood glucose level of mice after 15/20 weeks fed with normal diet and HFD (n=8); (H-O) Representative images of H&E staining shown morphology of ovaries from mice after 15/20 weeks fed with different diet, in H, I, J, K and M, scale bars= 150 μm; in L and N, scale bars = 15 μm; in O, scale bars = 30 μm. *P<0.05 vs. 15W-NC group; **P<0.01 vs. 15W-NC group; ***P<0.001 vs. 15W-NC group; #P<0.05 vs. 20 W-NC group; ## P<0.01 vs. 20 W-NC group; ### P<0.001 vs. 20 W-NC group. ***P<0.001 vs. 15W-NC group; ### P<0.001 vs. 20 W-NC group; ✝ P<0.001 vs. 15W-HFD group. NC: normal control diet group; HFD: high fat diet group; CL: corpus luteum; OC: oocyte; GC: granulosa cell; W: weeks.


