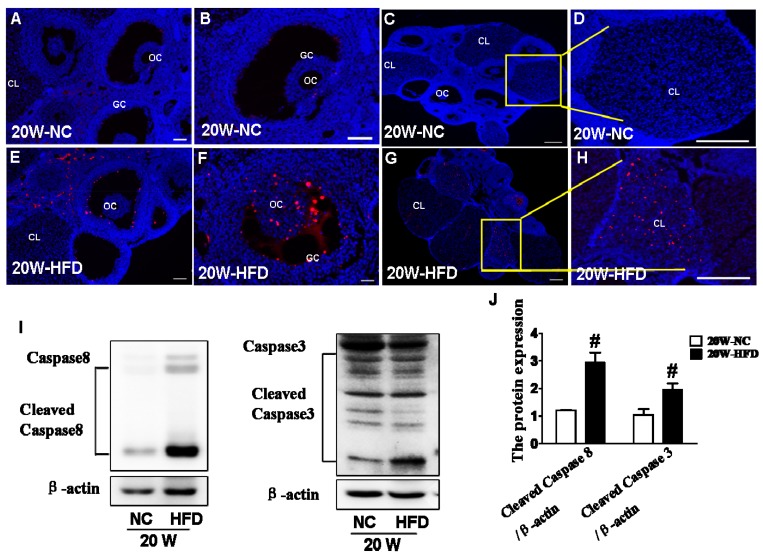
Figure 4.
DIO-type 2 diabetes triggered caspase activation and subsequent apoptosis in ovary. (A) Representative images of TUNEL staining shown apoptotic cells (red signal) in ovaries from mice after fed with different diet for 20 weeks, in A and E, scale bars= 30 μm; in B, D, F and H, scale bars= 15 μm; in C and G, scale bars= 150 μm. (B) The protein levels of Caspase8 and Caspase 3 in ovaries from mice after fed with different diet for 20 weeks. (C) Intensities of cleaved-Caspase8 and cleaved-Caspase 3 normalized to β-actin. Data are presented as the mean ± standard deviation (n=3). # P<0.05 vs. 20W-NC group. NC: normal control diet group; HFD: high fat diet group; CL: corpus luteum; OC: oocyte; GC: granulosa cell; W: weeks.

