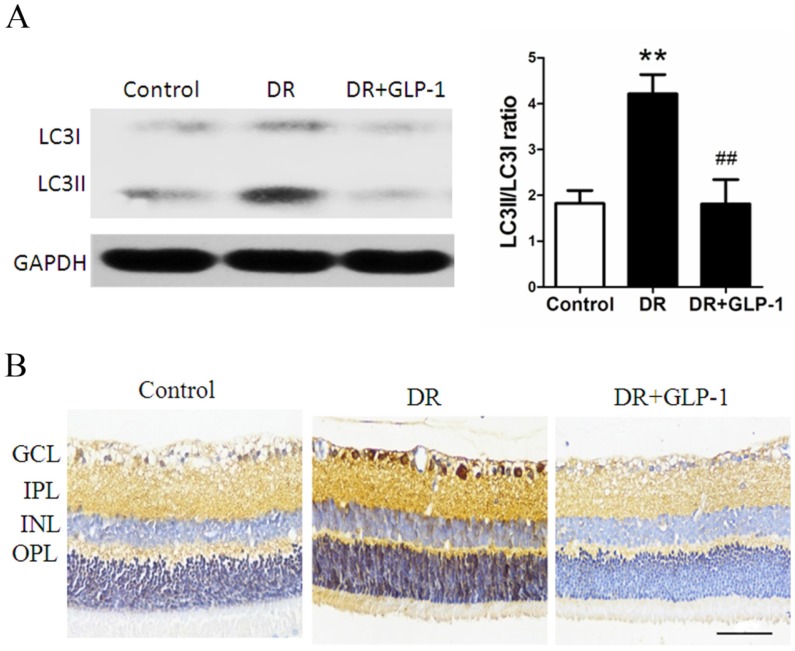
Figure 3.
Reduction of LC3B protein expression through GLP-1 treatment. (A) Western blot analysis of retinal LC3B expression in three groups. (B) Immunohistochemistry of retinal GLP-1R in three groups. Data are expressed as the means ± SEM. Statistical analyses were performed by one-way ANOVA followed by Tukey's test. **P<0.01 versus the normal group, ## P<0.01 versus the DR group. The scale bar represents 50μm.

