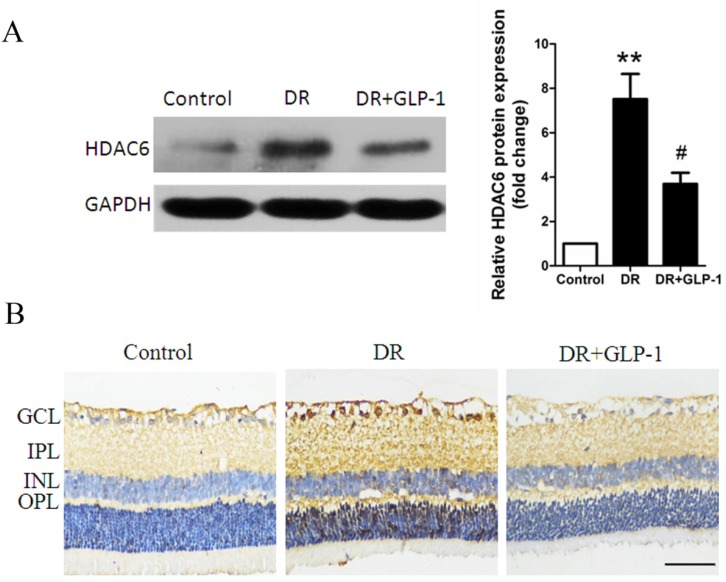
Figure 7.
Reduction of HDAC6 protein expression by GLP-1 treatment in diabetic rat retinas. (A) Western blot analysis of retinal HDAC6 expression in three groups. (B) Immunohistochemistry analysis of retinal HDAC6 in three groups. Data are expressed as the means ± SEM. Statistical analyses were performed by one-way ANOVA followed by Tukey's test. **P<0.01 versus the normal group, # P<0.05 versus the DR group. The scale bar represents 50μm.

