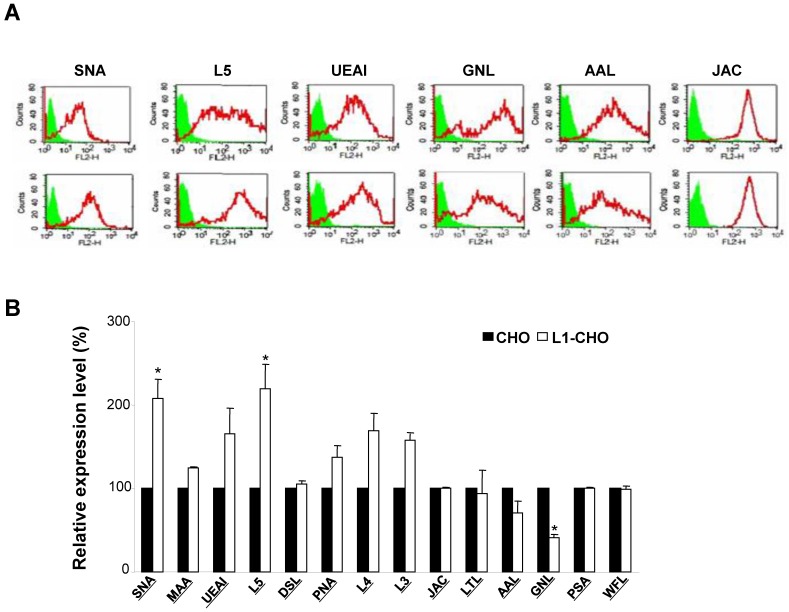
Figure 1.
Glycosylation patterns on cell surface of CHO cells and L1-transfected CHO cells. CHO cells and L1-CHO cells were subjected to flow cytometry analysis using a panel of carbohydrate surface markers, including lectins and antibodies against carbohydrates. A. In the flow cytometry histograms, the areas in green show the number of unstained cells and the areas outlined in red represent cells binding to carbohydrates antibodies L5 and various lectins including SNA (Sambucus nigra lectin), MAA (Maackia amurensis lectin), UEAI (Ulex europaeus agglutinin I), DSL (Datura stramonium lectin) and JAC (Jacalin). B. The quantitative results showed that the expression of carbohydrates recognized by SNA as well as L5 antibodies were significantly increased in L1-CHO cells versus CHO cells. *: p<0.05, by Student's test.

