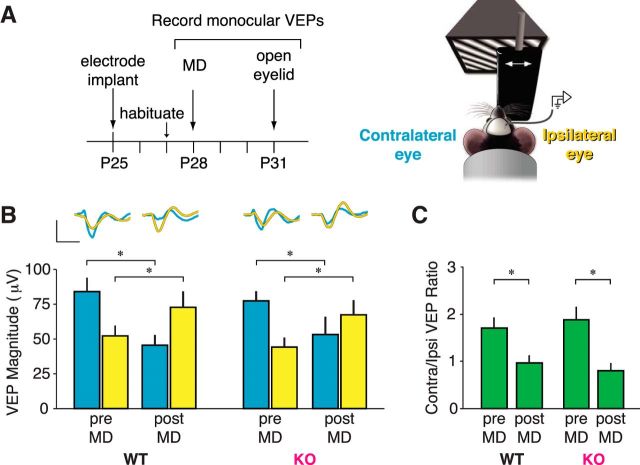
Figure 4.
Effect of brief MD on OD shift unaffected in Cx3cr1 mutants. A, Left, Timeline of 3 d MD experiment. Right, Diagram of VEP recording apparatus: an awake mouse is head-restrained in front of a computer screen with a phase-reversing grating stimulus presented monocularly, with an occluder blocking one eye. VEPs driven by the eye contralateral to the recorded hemisphere are shown in blue and the eye ipsilateral to the recorded hemisphere is shown in yellow. B, After 3 d of MD of the contralateral eye (post-MD), VEPs driven by the contralateral/deprived eye decrease significantly in both genotypes (ANOVA condition, p < 0.001; WT pre-MD vs WT post-MD, p = 0.003; KO pre-MD vs KO post-MD, p = 0.044), while VEPs driven by the ipsilateral/open eye increased significantly in both genotypes (ANOVA condition, p < 0.001; WT pre-MD vs WT post-MD, p = 0.031; KO pre-MD vs KO post-MD, p = 0.007). C, The OD shift can be measured through a ratio of contralateral VEP to ipsilateral VEP, shifting from ∼2:1 to 1:1 following MD in both WT and KO animals (scale bar for traces: 50 μV by 100 ms; n = 15 WT animals, 15 KO animals; post hoc tests, *p < 0.05 after 2-way ANOVA).

