
Figure 8.
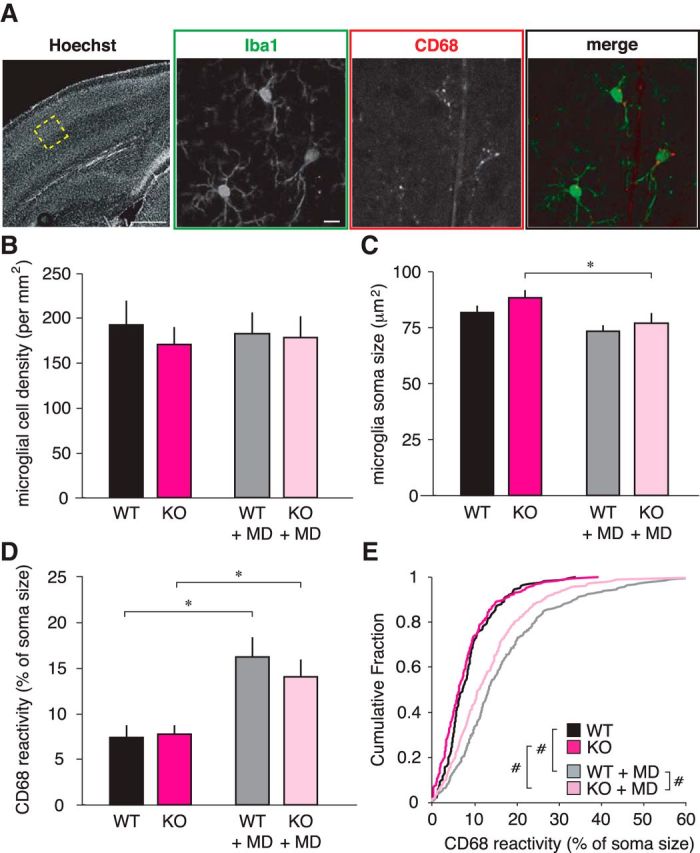
Microglia have increased lysosome content following brief MD. A, Example images of microglia in L4 of binocular V1 (cortical structure identified with Hoechst 33342; scale bar, 500 μm) stained with anti-Iba1 to label all microglia (green; scale bar, 10 μm), and anti-CD68 to label microglial lysosomes (red). In the merged image, the CD68 puncta are specific to microglial somas (except for blood vessels; note the faint vertical line running through the image). B, In the hemisphere contralateral to the deprived eye, the density of microglia in L4 is not different between genotypes (ANOVA genotypes, p = 0.572) or following MD (ANOVA MD condition, p = 0.968). C, The volume of the microglia soma (i.e., excluding ramified processes) decreases slightly in WT animals following MD, though not significantly (p = 0.059), as well as decreasing in KO animals (p = 0.014), which may be a product of increased ramification. D, Per animal averages of the amount of lysosome content within microglial somas increases following MD in both genotypes (WT, p = 0.003; KO, p = 0.026). E, Cumulative distributions of individual microglial CD68 increase following MD. On this per-microglia basis, CX3CR1 KO+MD microglia have less lysosome reactivity when compared with WT+MD microglia (WT vs KO, p = 0.093; WT vs WT+MD, p < 0.001; KO vs KO+MD, p < 0.001; WT+MD vs KO+MD, p = 0.001; post hoc tests, *p < 0.05 after 2-way ANOVA; #p < 0.005, Mann–Whitney U test; n = 4 WT, 4 WT+MD, 6 KO, 6 KO+MD animals).