
Figure 4.
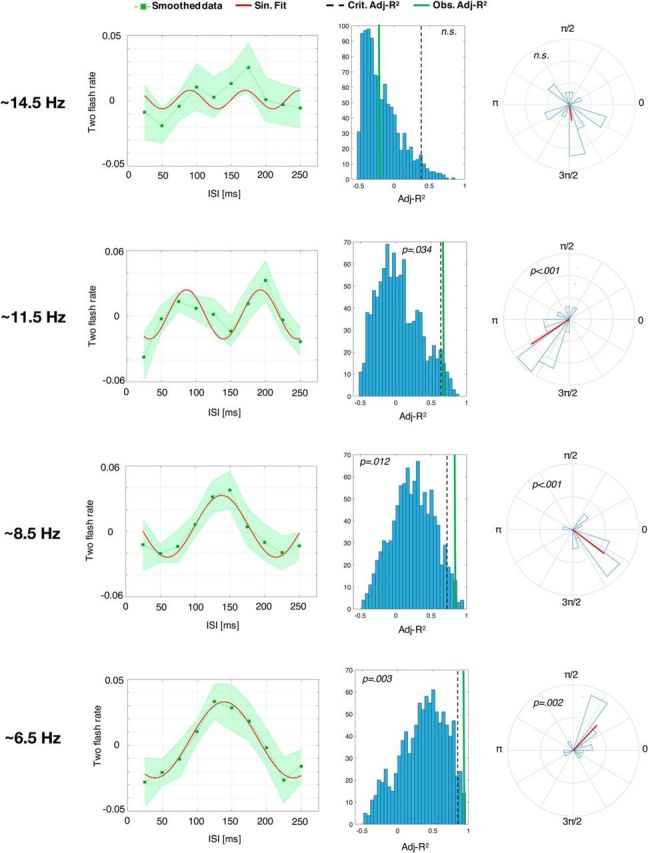
Changes in perceptual oscillations as a function of the sensory entrainment frequency within and outside of the alpha band (Experiment 2: within-subjects design). Left, Smoothed data (i.e., moving average applied) with the shaded area representing ±1 SEM and the continuous line depicting the best sinusoidal fit in the frequency range of interest (see Materials and Methods). As evidenced from the histograms on the middle column, in all cases except for the entrainment at beta, the observed adjusted R2 (continuous vertical lines) was higher than the critical adjusted R2 value (dashed vertical line) representing the 5° percentile in the null distribution obtained from the permutation of the original data. Right, Phase angle histograms for all the entrainment frequencies with all perceptual oscillations except the one after entrainment at beta, showing significant phase concentration across participants (mean phase angle vector across participants is depicted in red).