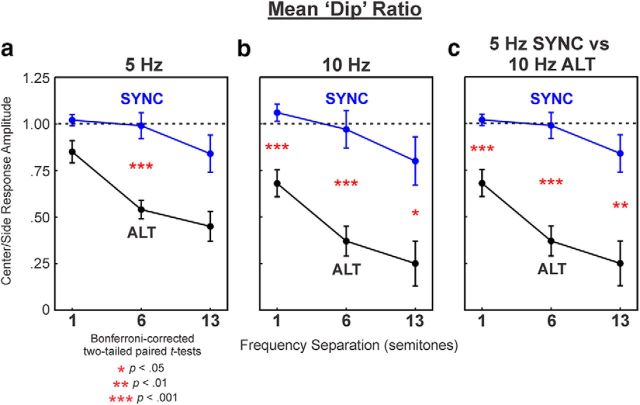
Figure 6.
Dip ratios averaged across recording sites in LL3 as a function of frequency separation. Mean ratios under SYNC and ALT conditions are represented by the blue and black symbols, respectively. Error bars represent the SEM. Mean ratios under the 5 and 10 Hz PR conditions are plotted in a and b. Comparison between mean ratios in the SYNC condition at 5 Hz PR and in the ALT condition at 10 Hz PR is shown in c. Asterisks indicate statistically significant differences (based on Bonferroni-corrected p values) between SYNC and ALT conditions at each value of ΔF tested. See Results for discussion and Table 1 for further details.

