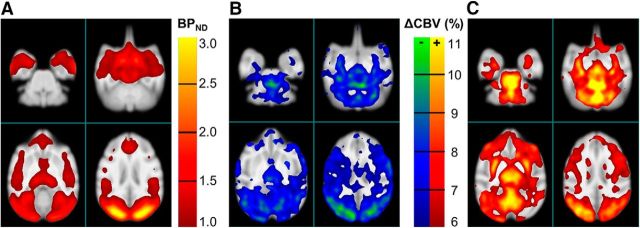
Figure 2.
Spatial distribution of PET and MR signals. A, Binding potential map of [11C]AZ10419369 (averaged across 7 scans) and (B) negative CBV change and (C) positive CBV changes. Images are averages across six experiments with AZ10419369 doses ranging between 0.88 and 5.0 μg/kg. PET data were smoothed with a 3.5 mm Gaussian filter. The p value for thresholding of CBV change was p < 0.001.

