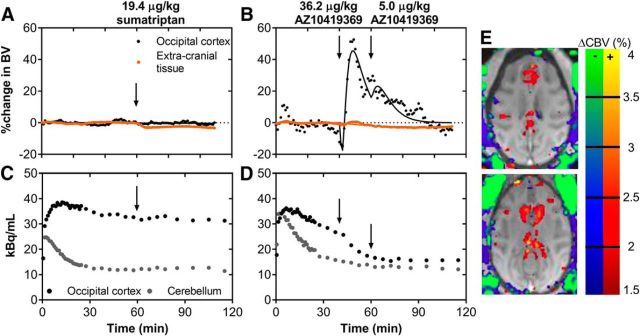
Figure 3.
Within-scan challenges of 5-HT1BR agonists sumatriptan and AZ10419369. A, CBV changes in the occipital cortex and peripheral tissue in response to the 19.4 μg/kg sumatriptan challenge. B, CBV changes in the occipital cortex and extracranial tissue in response to the 36.2 μg/kg and 5.0 μg/kg AZ10419369 challenges. C, Time-activity curve of [11C]AZ10419369 for the corresponding sumatriptan challenge experiment. D, Time-activity curve [11C]AZ10419369 for the corresponding AZ10419369 challenge experiment. E, Map of blood volume changes in the NHP brain and peripheral tissue in two representative transverse planes. Changes in blue/green colors represent decreases in CBV, whereas changes in yellow/red represent increases in CBV.

