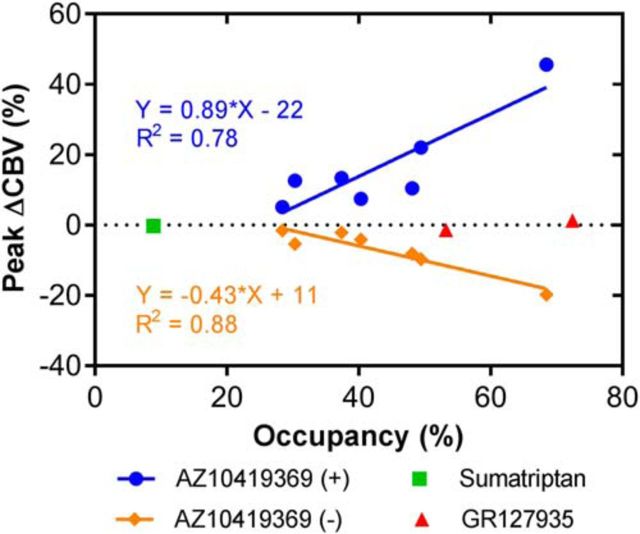
Figure 5.
Correlation between the relative changes in 5-HT1BR binding and the relative peak changes in CBV in the occipital cortex. The correlation with the decrease in CBV is visualized with orange diamonds, the increase in CBV with blue circles, sumatriptan with a green square, and GR127935 with red triangles. The linear regression of the correlation and the goodness of fit (R2) are indicated.

