Figure 3.

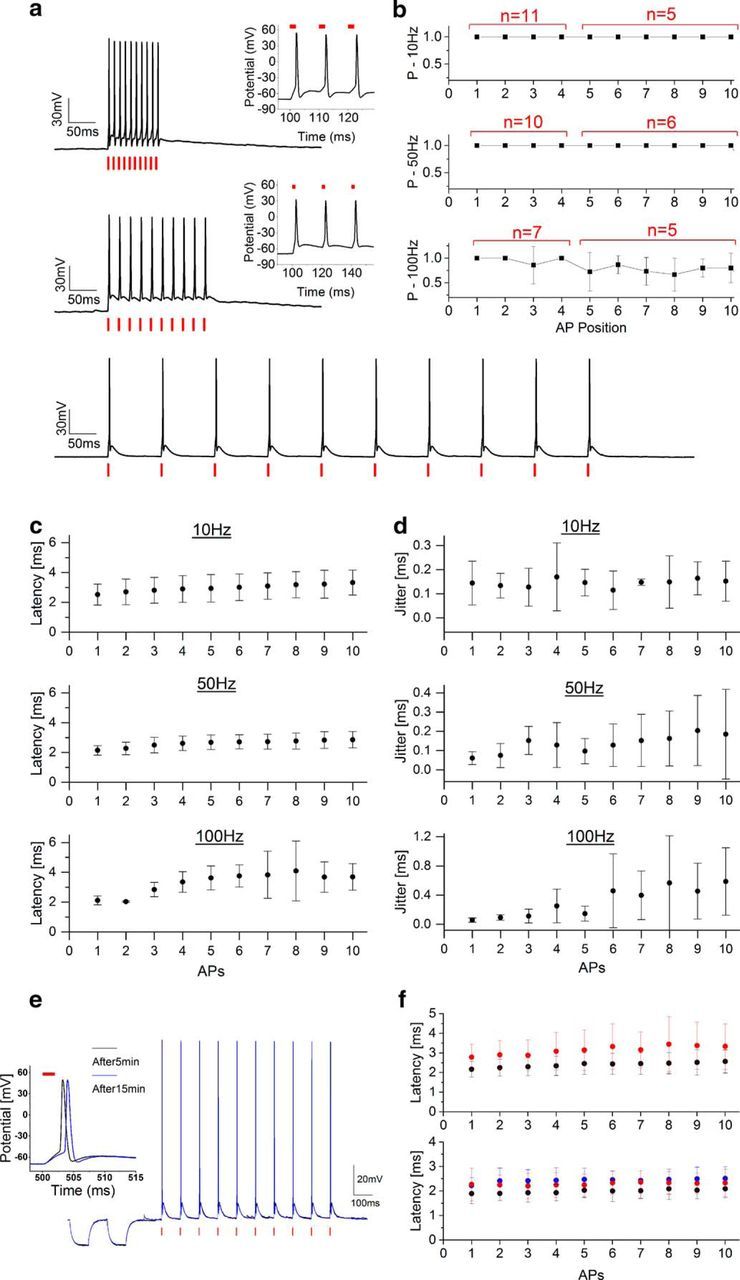
Light-driven spiking fidelity across different frequencies in Chronos-expressing interneurons. a, Sample trains of 10 photostimulation pulses of 2 ms duration each over different frequencies: 10 Hz, p = 0.09 mW/μm2 (bottom); 50 Hz, p = 0.09 mW/μm2 (middle); 100 Hz, p = 0.12 mW/μm2 (top). b, Spike probability within the 10 pulses (cells have been photostimulated either with four or 10 light-pulse trains; red shows the number of cells in which the i-th spike has been tested). c, d, Latency (c) and jitter (d) of each light-evoked spike of the train. Illumination power range: 0.05–0.17 mW/μm2, 2–3 ms illumination pulse duration, 10–15 μm diameter spot, λ = 1030 nm. Data are shown as mean ± SD. e, Trains of 10 pulses at 10 Hz triggered every 6 s after 5 min (black line) and after 15 min (blue) preceded by resistance steps. f, Latencies of each light-evoked spike within the train after 0 min (black) and 3.5 min (red; Top, n = 5 cells) and 0 min (black), 3.5 min (red), and 7 min (blue; bottom, n = 3 cells).
