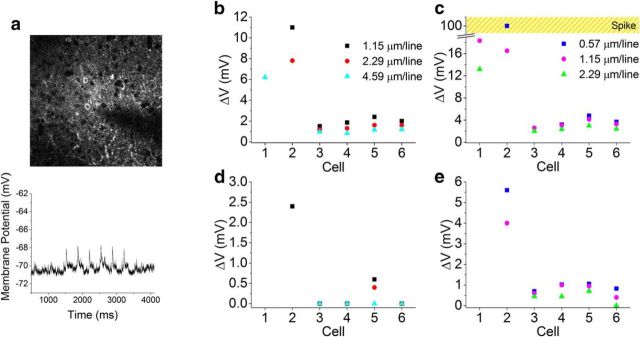
Figure 5.
Scanning imaging effects on Chronos-expressing interneurons. a, 2P image of a patched Chronos-exressing neuron of acute cortical brain slices acquired by raster scanning a 920 nm femtosecond beam (FOV 294 μm; 1.15 μm/line; 2.96 Hz frame rate; p = 14 mW; top); corresponding membrane potential depolarization is shown at bottom. b–e, Membrane depolarizations obtained on different cells by raster scanning a 920 nm beam over 294 μm (b, d) and 147 μm (c, e) with 14 mW (b, c) and 5 mW (d, e) excitation power for various line-scanning resolutions at 1.32 ms/line.

