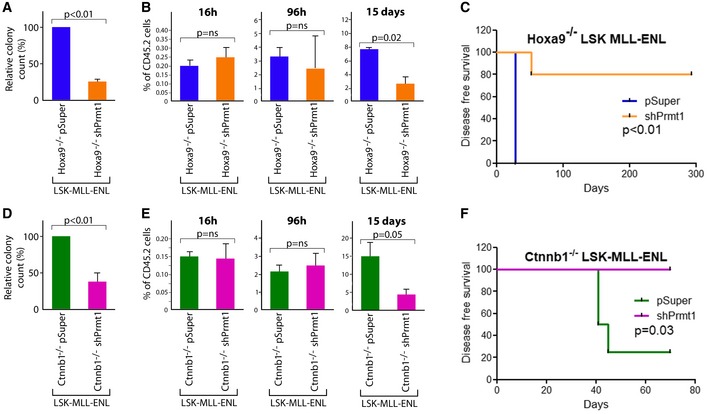
The relative number of colonies from Hoxa9
−/− LSK‐MLL‐ENL leukemic cells with empty vector or shPRMT1 (n = 3, t‐test).
The % of CD45.2+ donor cells in the bone marrow of recipient mice at the indicated time points post‐transplantation of Hoxa9
−/− LSK‐MLL‐ENL leukemic cells with empty vector or shPrmt1 (n = 4, t‐test).
Kaplan–Meier survival curve of secondary recipient mice transplanted with Hoxa9
−/− LSK‐MLL‐ENL leukemic cells with vector control or shPrmt1 (n = 5/cohort, log‐rank test).
The relative number of colonies from Ctnnb1
−/− LSK‐MLL‐ENL leukemic cells with empty vector or shPRMT1 (n = 3, t‐test).
The % of CD45.2+ donor cells in the bone marrow of recipient mice at the indicated time points post‐transplantation of Ctnnb1
−/− LSK‐MLL‐ENL leukemic cells with empty vector or shPrmt1 (n = 4, t‐test).
Kaplan–Meier survival curve of secondary recipient mice transplanted with Ctnnb1
−/− LSK‐MLL‐ENL leukemic cells with vector control or shPrmt1 (n = 4/cohort, log‐rank test).
Data information: Data are represented as mean ± SD. See also
.

