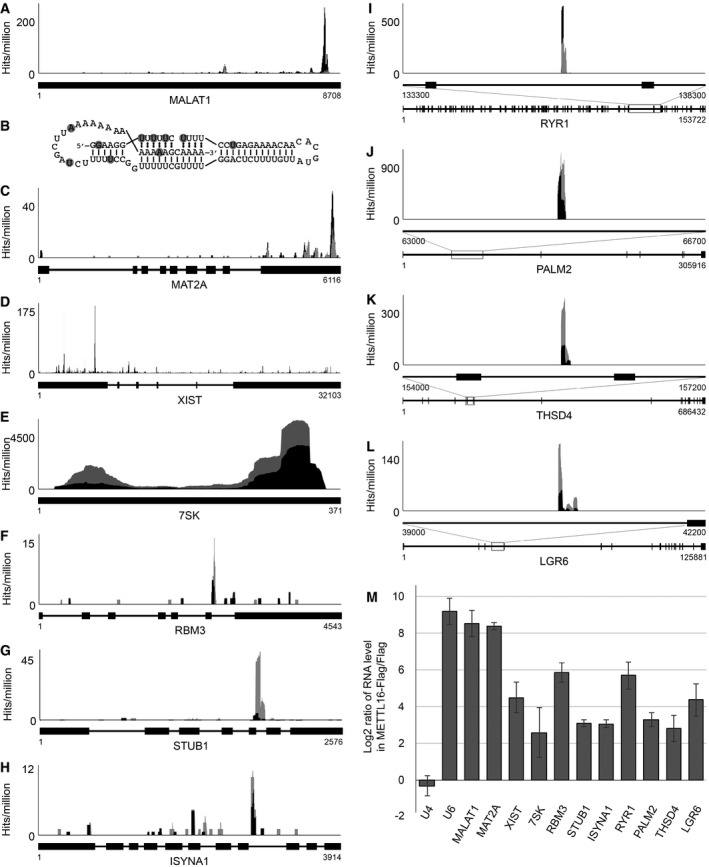
Figure 4. Various pre‐mRNAs, lncRNAs and ncRNAs are bound by METTL16.

-
AThe relative distribution of CRAC sequence reads (UV‐CRAC—black; PAR‐CRAC—grey) mapping to the MALAT1 lncRNA is shown as hits per million mapped reads. Numbers below the schematic representation of the transcript indicate nucleotide positions.
-
BSecondary structure of the MALAT1 triple helix with nucleotides UV crosslinked to METTL16 highlighted with grey circles.
-
C–LThe relative distribution of CRAC sequence reads (UV‐CRAC—black; PAR‐CRAC—grey) mapping to the MAT2A mRNA (C), the XIST lncRNA (D), the 7SK ncRNA (E), and the RBM3 (F), STUB1 (G), ISYNA1 (H), RYR1 (I), PALM2 (J), THSD4 (K) and LGR6 (L) mRNAs is shown above schematic views of the introns (black lines) and exons (black boxes) present in the transcripts. For large mRNAs (I–L), a magnified view of the region of the pre‐mRNA that is crosslinked to METTL16 is shown (top, middle) above the schematic view of the whole mRNA.
-
MExtracts prepared from HEK293 cells expressing METTL16‐Flag or the Flag tag were used in immunoprecipitation experiments and co‐precipitated RNAs were isolated. RT–qPCR was performed to detect the indicated transcripts. Log2 fold changes between the levels of each transcript detected in the eluates of the METTL16‐Flag and the Flag control immunoprecipitations are shown. Data from three independent experiments are presented as mean ± SD.
