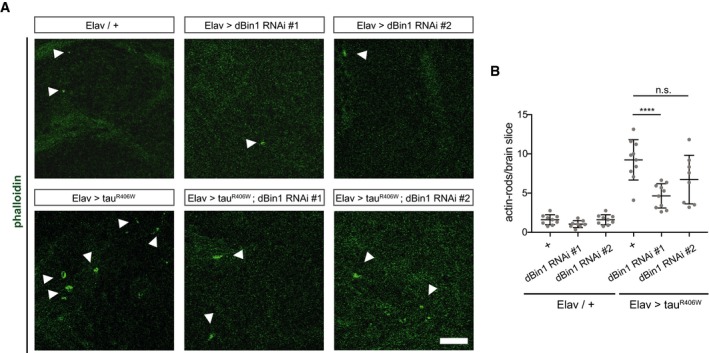
Figure 6. dBin1 modulates actin dynamics in vivo .

- TauR406W expressing Drosophila brains with endogenous dBin1 levels display more actin rods in the brain than in the brains of tauR406W transgenic flies in which dBin1 was downregulated. Phalloidin staining of whole‐mount brain (22 days old), dissected from tauR406W transgenic flies. Here, a zoom‐in is displayed (scale bar = 10 μm). White arrowheads indicate phalloidin‐positive actin inclusions.
- Quantification of actin rods per brain slice. Statistically significant differences are indicated (one‐way ANOVA, n.s. = not significant, ****P < 0.0001, n = 8–10). The error bars represent mean ± SD.
