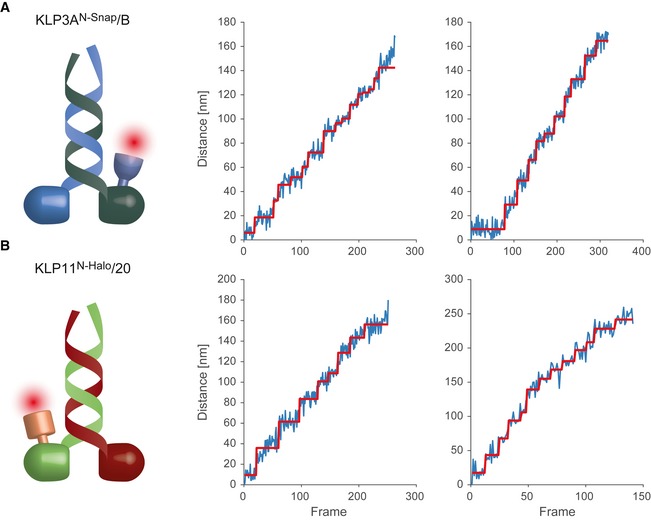
Figure EV1. Single fluorophore tracking of KLP11/20 and KLP3A/B motors at limiting ATP concentrations.

-
A, BPhotons from a single fluorophore detected on the CCD are localized and tracked over time. Localization is achieved by fitting a two‐dimensional Gaussian profile to the spot. The Euclidean distance of each location to the position in the first frame is calculated and plotted in blue. Steps in the data are detected by a gliding t‐value algorithm and plotted in red. Frames have a cycle time of 505 ms.
