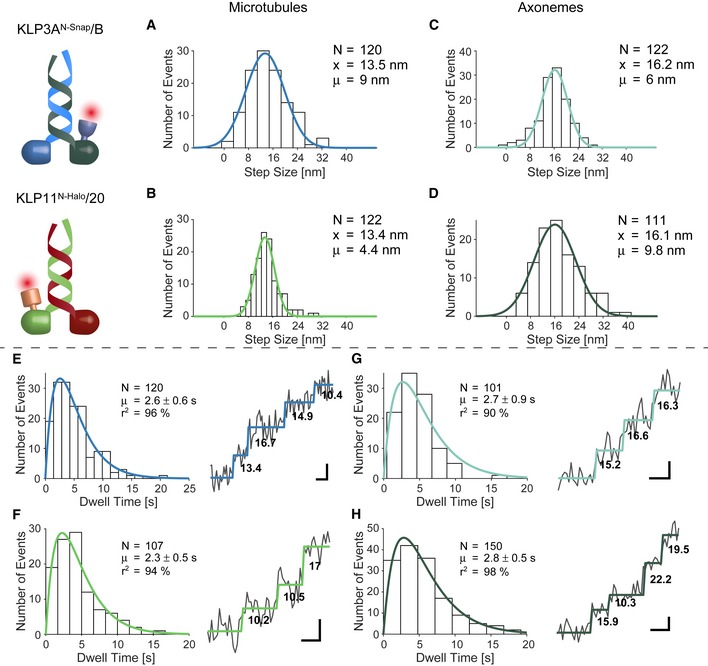
Tracking of the fluorescently labeled head domains KLP3A and KLP11 of the heterodimeric kinesin‐2 motors at limiting ATP concentrations. Note the corresponding colors in upper and lower panels.
-
A, B
The step size distribution centered around ˜13 nm when walking on microtubules. Together with the double‐exponential decay of the dwell times (E, F), these results support a hand‐over‐hand type stepping of the respective motors.
-
C, D
Tracking on axonemes increased step size distribution to ˜16 nm which is consistent with protofilament tracking.
-
E, F
Double‐exponential decay of the dwell times and raw stepping data with detected steps.
-
G, H
Double‐exponential decay of the dwell times again argues for a hand‐over‐hand stepping mechanism on axonemes.
Data information: (E–H) Steps are shown with the detected stepping pattern in red and the calculated step size in nm. Scale bars are 5.04 s (10 frames) wide and 10 nm high. The respective step sizes are fit to a normal distribution (
x is mean, and μ is width of the distribution). Dwell times are fit to a double‐exponential distribution (± confidence interval). See Fig
EV1 for more step data and
Appendix Fig S7 for the respective kymographs. A two‐sample
t‐test has confirmed the statistical significance of the difference between the step size distributions on microtubules versus axonemes (
P‐values of 3e‐5 for KLP11/20 and 0.05 for KLP3A/B, respectively).

