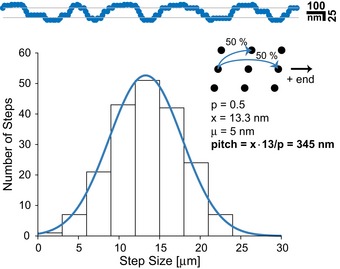
Figure EV3. Dependence between the trajectory and the step size distribution of a motor taking sidesteps.

The stepping of a motor was modeled on a cylinder‐shaped geometry with binding sites distributed as expected for the microtubule lattice 72. A sidestepping probability of 50% was assumed, and 200 steps were simulated. The data were projected onto a plane to simulate a microscope image. For the histogram, step sizes were blurred by a Gaussian distribution of width 3 nm corresponding to an estimated detection accuracy. The pitch for a 13 protofilament microtubule is calculated from the mean step size (x) and the probability for sidesteps (P).
