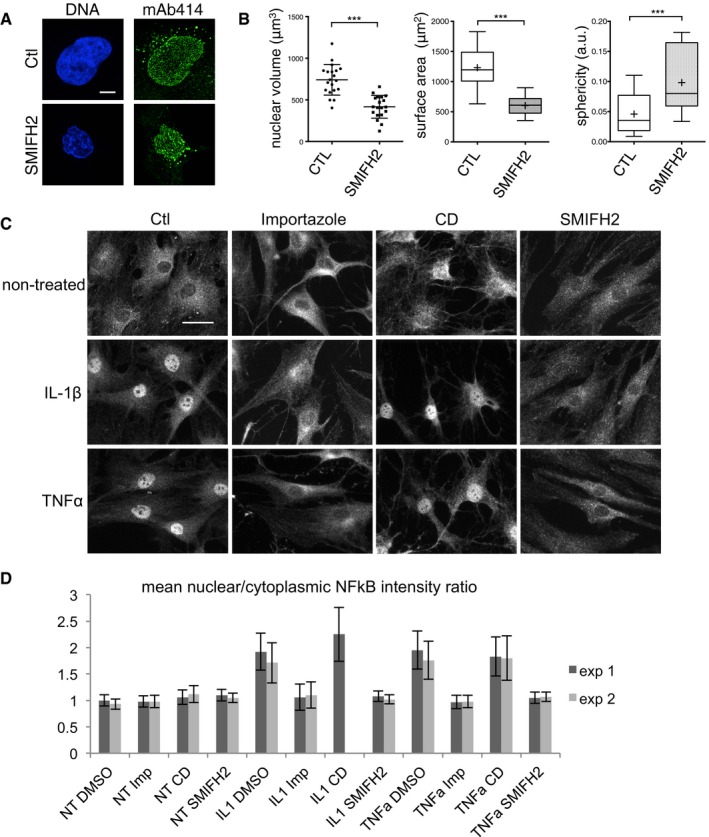
Confocal planes of nuclei of cells treated with DMSO (Ctl) or SMIFH2 (50 μM) for 4 h, stained with mAb414 and DAPI (DNA). Scale bar, 5 μm.
Characterisation of nuclear morphology from (A) (mean ± SD of 20 cells from two independent experiments; ***P‐value < 0.0001; Student's t‐test). Scatter plot, lines are mean ± SD; box plots, whiskers: min and max values, crosses are means.
Immunofluorescence images of RA‐FLS fibroblasts, treated for 1 h with DMSO (Ctl), importazole (50 μM), CytD (40 μM) or SMIFH2 (50 μM), subsequently stimulated or not with IL‐1β or TNF‐α, stained for NF‐κB. Scale bar, 20 μm.
Quantification of the data presented in (C). Mean nuclear/cytoplasmic NF‐κB intensity ratio (± SD) of two independent experiments using two different fibroblast sources; n ≥ 400 for each condition; CytD sample was lost in exp 2.

