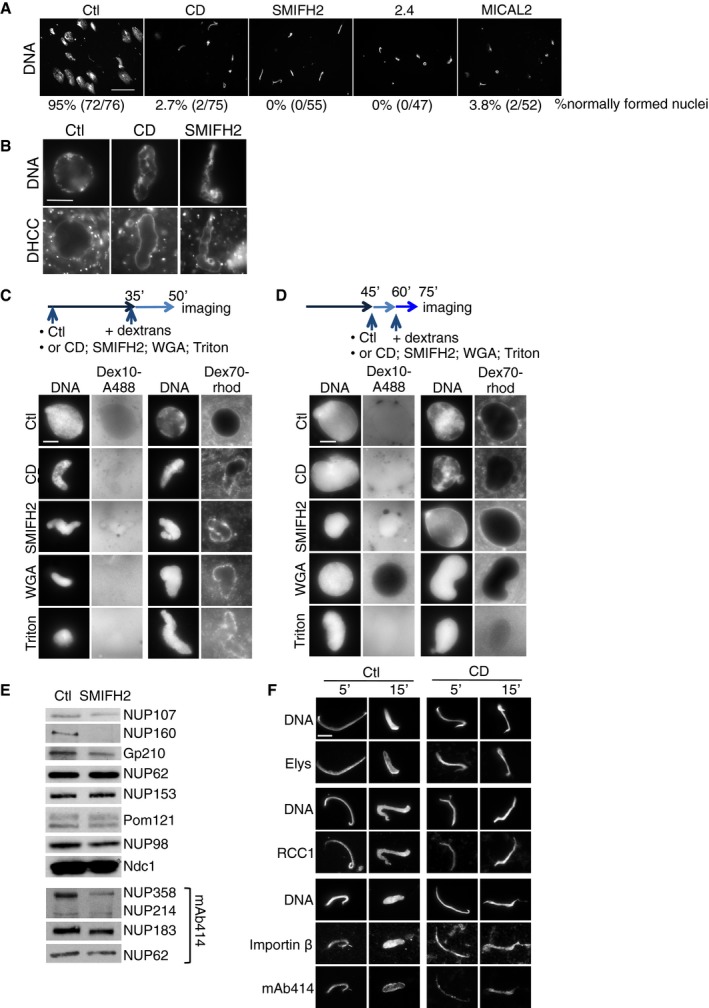
Figure EV4. Active nuclear transport requires actin dynamics.

- Immunofluorescence images of nuclei formed in control extracts, or extracts supplemented with the indicated drug or MICAL2 recombinant protein. DNA was stained with Hoechst and the number of normally assembled nuclei was determined. Scale bar, 50 μm.
- Immunofluorescence images of nuclei formed in control or CytD (CD)‐ or SMIFH2‐treated extracts as in Fig 5B. Nuclear membranes were visualised with the lipid dye DHCC. Nuclei were analysed at 60 min. Scale bar, 10 μm.
- Scheme: Nuclei were formed in control extract or in the presence of CytD (CD), SMIFH2, WGA or Triton; at 35 min Dextran10‐Alexa488 (Dex10‐A488) or Dextran70‐rhodamine (Dex70‐rhod) were added; nuclei were imaged directly at 50 min. Scale bar, 10 μm.
- Scheme: Nuclei were formed in control extract; at 45 min, CytD (CD), SMIFH2, WGA or Triton was added, followed by the addition of Dextran10‐Alexa488 (Dex10‐A488) or Dextran70‐rhodamine (Dex70‐rhod); nuclei were imaged directly at 75 min. Scale bar, 10 μm.
- Western blots of total nuclear fractions in control and formin‐inhibited (SMIFH2) extracts, probed with antibodies to the NUPs indicated; the same number of nuclei was analysed for each condition.
- Immunofluorescence images of nuclei formed for 5 and 15 min in control or cytochalasin D‐treated extracts, stained for DNA, Elys, RCC1, importin‐β and FG‐NUPs (mAb414). Scale bar, 10 μm.
Source data are available online for this figure.
