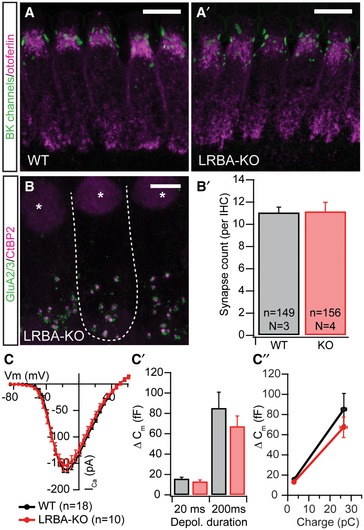
Figure EV2. Normal maturation, synapse count, and synaptic function in Lrba mutant IHCs.

-
A, A′Spotlike BK channel (green) staining at the IHC neck region indicates normal IHC maturation in Lrba mutant mice; IHCs have been counterstained for otoferlin (magenta). Scale bar: 5 μm.
-
B, B′Synapse count in apical turn IHCs from p14–16 WT and Lrba‐KO mice, as assessed by presynaptic CtBP2 (magenta) and postsynaptic GluA2/3 (green) co‐staining remains unaltered, as quantified in (B′). Data are presented as means ± s.e.m. The dashed line in (B) outlines a single IHC, and asterisks indicate nuclei. Scale bar: 10 μm.
-
C–C″Electrophysiologically recorded whole‐cell Ca2+ current–voltage relationship from p14–17 IHCs show similar voltage dependence and current amplitudes in both genotypes. (C′) Exocytic ∆Cm in response to step depolarizations to the respective maximum Ca2+ current potential for either 20 ms (to deplete readily releasable vesicles) or 200 ms (to probe sustained exocytosis) revealed no statistically significant difference in synaptic release between WT (n = 18; N = 16) and Lrba‐KO IHCs (n = 10; N = 7) (P = 0.24 and P = 0.51, respectively; Student's t‐test). (C″) Similarly, release efficiencies for both depolarization durations (i.e., ∆Cm per QCa2+) appear unchanged in Lrba mutants. Data are presented as means ± s.e.m.
