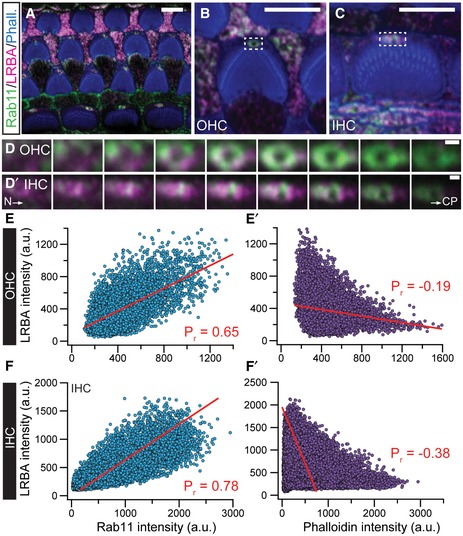
Figure EV3. LRBA partially colocalizes with the intracellular transport vesicle‐associated protein Rab11 at the kinociliar pore of cochlear hair cells.

-
Ap7 wild‐type organs of Corti were co‐stained with specific antibodies against Rab11 (green) and LRBA (magenta). Fluorophore‐conjugated phalloidin (blue) was used to visualize actin‐rich stereocilia. Representative single optical section of an organ of Corti overview at the height of the cuticular plates. Scale bars: 5 µm.
-
B, CRepresentative magnified views of a single (B) OHC and (C) IHC, respectively. Scale bars: 5 µm.
-
D, D′Detailed incremental z‐stacks of the dashed boxes in (B and C), illustrating the overlapping signal between Rab11 and LRBA (as indicated by “white pixels”) in ascending optical planes (step size 200 nm) from the hair cell neck (N) through the cuticular plate (CP) of a representative (D) OHC and (D′) IHC. Scale bars: 1 µm.
-
E–F′Pixel‐based intensity analysis performed on the representative example images shown in panels (B and C) for LRBA and Rab11 or (E′–F′) LRBA and phalloidin as an internal control. Pearson's correlation coefficients (Pr; marked in red in the respective panels) were determined by fitting the data sets with linear regressions and illustrate the positive correlation for LRBA and Rab11. In contrast, LRBA and phalloidin signals show a negative correlation and hence do not colocalize (please also refer to Fig 4F–F″ in this context). Scale bars: 1 µm.
