-
A–B′
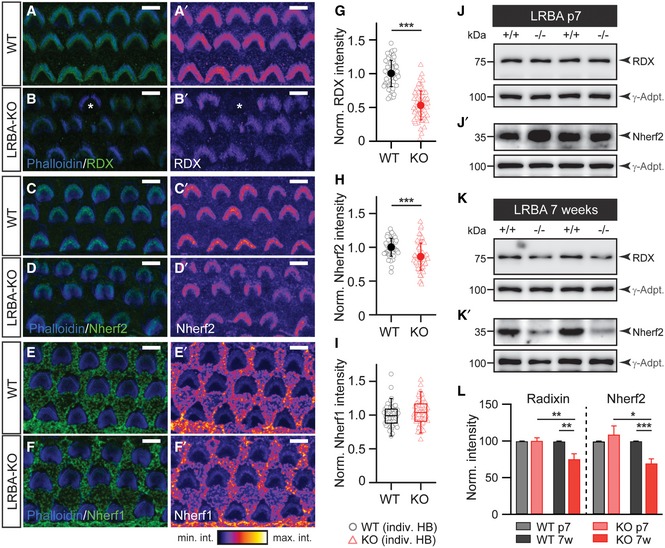
Representative images of radixin immunofluorescence in hair bundles from p7 (A, A′) WT and (B, B′) Lrba‐KO. Few hair bundles completely lacking radixin fluorescence (e.g., marked with * in B and only observed in Lrba‐KOs) have been excluded from analysis to provide a rather conservative estimate. Panels (A′ and B′) show RDX immunofluorescence signal illustrated with an intensity‐coded lookup table for improved visualization of the fluorescence intensity distribution. Scale bars: 5 μm.
-
C–D′
Representative images of Nherf2 immunofluorescence in hair bundles from (D) WT and (D′) Lrba‐KO. Panels (C′ and D′) show Nherf2 immunofluorescence signal illustrated with an intensity‐coded lookup table for improved visualization of the fluorescence intensity distribution. Scale bars: 5 μm.
-
E–F′
Representative images of Nherf1 immunofluorescence in hair bundles from (E) WT and (F) Lrba‐KO. Panels (E′ and F′) show Nherf1 immunofluorescence signal illustrated with an intensity‐coded lookup table for improved visualization of the fluorescence intensity distribution. Scale bars: 5 μm.
-
G
Normalized average fluorescence intensity of RDX expression in WT and Lrba‐KO samples indicates dramatically reduced expression in the mutants (n = 71/65 hair cells; N = 5 cochleae). Quantification of data presented in (A–B′) (mean ± s.d.). ***P < 0.001 (Student's t‐test).
-
H
Normalized average fluorescence intensity of Nherf2 expression from WT and Lrba‐KO samples illustrates decreased Nherf2 expression (n = 61/62 hair cells; N = 3 cochleae) in Lrba‐KO. Quantification of data presented in (C–D′) (mean ± s.d.). ***P < 0.001 (Student's t‐test).
-
I
Normalized average fluorescence intensity of Nherf1 expression from WT and Lrba‐KO samples illustrate comparable Nherf1 expression (n = 59/59 hair cells; N = 3 cochleae). Quantification of data presented in (E–F′). Data are presented as boxplots (median, inner/outer quartile + outlier range, since data were not normally distributed).
-
J, J′
Representative Western blots for (J) RDX and (J′) Nherf2 protein expression levels detected in cochlea extracts derived from p7 WT and Lrba‐KO mice. γ‐Adaptin (γ‐Adpt.) was used for normalization.
-
K, K′
Representative Western blots for (K) RDX and (K′) Nherf2 protein expression levels detected in cochlea extracts derived from 7‐week‐old WT and Lrba‐KO mice. γ‐Adaptin (γ‐Adpt.) was used for normalization.
-
L
Normalized average signal intensities of RDX and Nherf2 expression are significantly decreased in cochlea extracts derived from 7‐week‐old Lrba‐KO mice (p7 WT: N = 5; p7 KO: N = 7; 7‐week‐old WT and KO: N = 5; two‐way ANOVA (genotype × age) followed by one‐sample t‐test against 100%). γ‐Adaptin was used for normalization. Data are presented as means ± s.e.m. *P < 0.05; **P < 0.01; ***P < 0.001.
‐KO pairs were processed in parallel and images acquired at similar tonotopic positions for direct comparison. In (G–I), each data point represents the average fluorescence intensity of an individual hair bundle.

