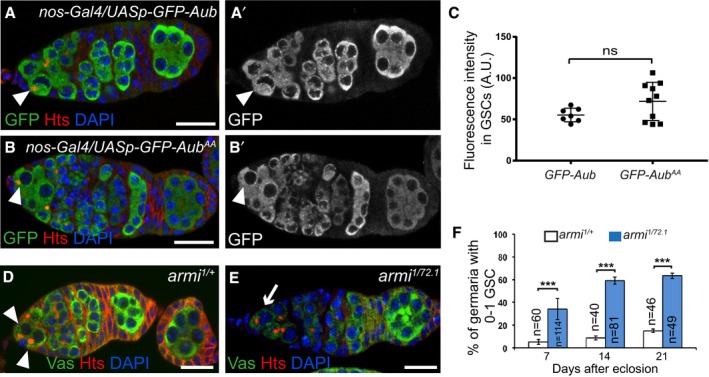
Figure EV3. Expression of GFP‐Aub transgenes in GSCs, and GSC loss phenotype in armi mutant.

-
A–B’GFP‐Aub and GFP‐AubAA are expressed at similar levels in GSCs using the nos‐Gal4 driver. Immunostaining of nos‐Gal4/UASp‐GFP‐Aub (A, A’) and nos‐Gal4/UASp‐GFP‐Aub AA (B, B’) ovaries with anti‐GFP (green) and anti‐Hts (red). DAPI (blue) was used to visualize DNA. White arrowheads indicate GSCs.
-
CQuantification of GFP‐Aub and GFP‐AubAA protein levels in GSCs using fluorescence intensity of immunostaining with anti‐GFP shown in (A’, B’). Fluorescence intensity was measured in arbitrary units using the ImageJ software. Horizontal bars correspond to the mean and standard deviation. ns, non‐significant using the two‐tailed Student's t‐test. The number of cells analyzed is shown in the figure as dots or squares.
-
D, EGSC self‐renewal defect in armi mutant. Immunostaining of control armi 1/+ (D) and armi 1/72.1 mutant (E) germaria with anti‐Vasa (green) and anti‐Hts (red). DAPI (blue) was used to visualize DNA. White arrowheads indicate GSCs; the white arrow indicates reduced number of GSCs.
-
FQuantification of germaria with 0–1 GSC shown in (D, E), in 7‐, 14‐ and 21‐day‐old females. The number of scored germaria (n) is indicated. Error bars represent standard deviation. ***P‐value < 0.001 using the χ2 test.
