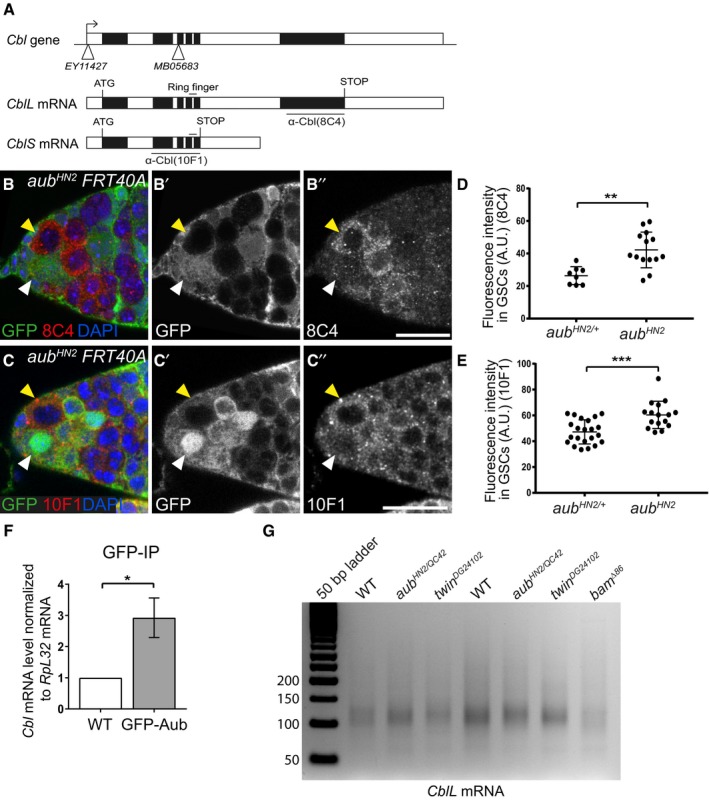
Figure 4. Aub represses Cbl expression in the GSCs.

-
AGenomic organization of the Cbl locus and Cbl mRNAs. Open boxes represent UTRs and introns, and black boxes are exons. The insertion points in the Cbl EY11427 and Cbl MB05683 mutants are represented by white triangles. The region encoding the E3 ubiquitin ligase domain (Ring finger) is indicated. The regions used to raise the 8C4 and 10F1 monoclonal antibodies are underlined.
-
B–C’’Immunostaining of mosaic germaria with anti‐GFP (green), to identify clonal cells by the lack of GFP, and either 8C4 (B–B’’) or 10F1 (C–C’’) monoclonal anti‐Cbl (red). DAPI was used to visualize DNA. White arrowheads indicate aub HN2/+ control GSCs; yellow arrowheads indicate clonal mutant aub HN2 GSCs. Scale bars: 10 μm.
-
D, EQuantification of Cbl protein levels in aub HN2/+ and aub HN2 mutant GSCs using fluorescence intensity of immunostaining with 8C4 or 10F1. Fluorescence intensity was measured in arbitrary units using the ImageJ software. Horizontal bars correspond to the mean and standard deviation. **P‐value < 0.01, ***P‐value < 0.001 using the two‐tailed Student's t‐test. The number of cells analyzed is indicated as the dots in the figure itself.
-
FRNA immunoprecipitation (IP) with anti‐GFP antibody in wild‐type (mock IP) and nos‐Gal4/UASp‐GFP‐Aub ovarian extracts. Cbl mRNA was quantified using RT–qPCR. Normalization was with RpL32 mRNA. Mean of three biological replicates. The error bar represents standard error to the mean. *P‐value < 0.05 using the two‐tailed Student's t‐test.
-
GePAT assay of CblL mRNA. Ovaries from 1‐day‐old (germarium to stage 8) wild‐type, aub and twin mutant females, and from 4‐ to 7‐day‐old bam mutant females were used.
Source data are available online for this figure.
