-
A
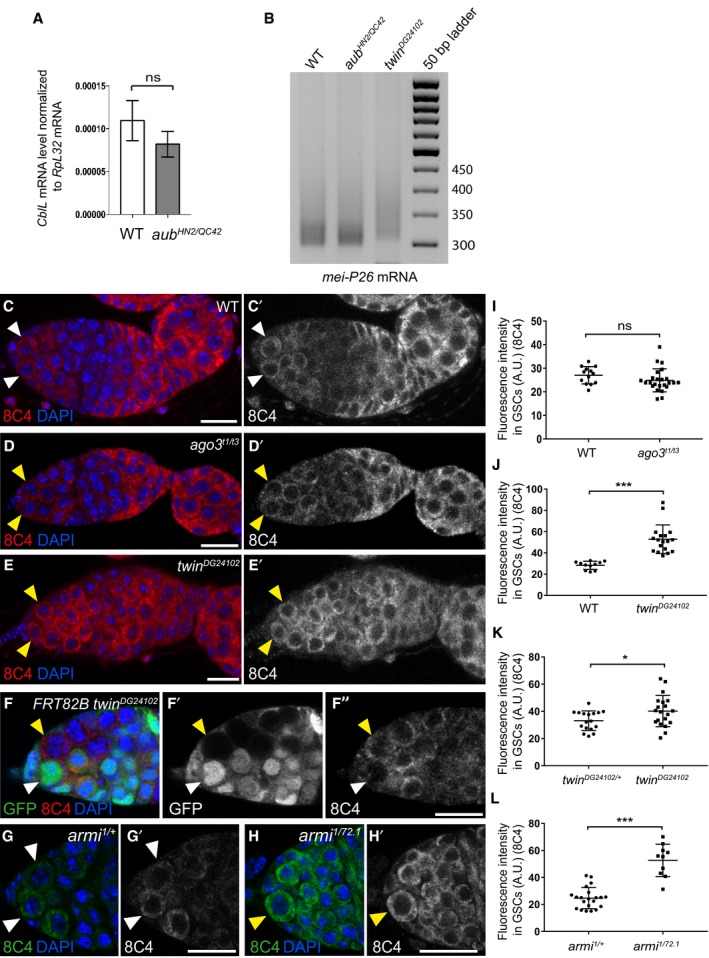
Quantification by RT–qPCR of CblL mRNA in dissected germaria/early egg chambers from wild‐type and aub
HN2/QC42 females. Normalization was with RpL32 mRNA. Mean of three biological replicates. Error bars represent standard error to the mean. ns, non‐significant using the two‐tailed Student's t‐test.
-
B
ePAT assay of mei‐P26 mRNA showing elongated poly(A) tail in twin mutant. Ovaries from 1‐day‐old (germarium to stage 8) wild‐type, aub and twin mutant females were used.
-
C–E’
Immunostaining of wild‐type (C, C’), ago3 mutant (D, D’), and twin mutant (E, E’) germaria with anti‐Cbl 8C4 antibody (red). DAPI (blue) was used to visualize DNA. White and yellow arrowheads indicate wild‐type and mutant GSCs, respectively.
-
F–F’’
Immunostaining of twin
DG24102 mosaic germaria 7 days after clone induction, with anti‐GFP (green) and 8C4 anti‐Cbl antibody (red). DAPI (blue) was used to visualize DNA. White arrowheads indicate control (twin
DG24102/+) GSCs; yellow arrowheads indicate twin
DG24102 mutant GSCs.
-
G–H’
Immunostaining of control armi
1/+ (G, G’) and armi
1/72.1 mutant (H, H’) germaria with anti‐Cbl 8C4 antibody (green). DAPI (blue) was used to visualize DNA. White and yellow arrowheads indicate wild‐type and mutant GSCs, respectively.
-
I–L
Quantification of Cbl protein levels in GSCs using fluorescence intensity of immunostaining with 8C4 antibody. Fluorescence intensity was measured in arbitrary units using ImageJ. Horizontal bars correspond to the mean and standard deviation. ***P‐value < 0.001, *P‐value < 0.05, ns, non‐significant, using the two‐tailed Student's t‐test. The number of cells analyzed is shown in the figure as dots or squares (I, J).
Data information: Scale bars: 10 μm in all panels.

