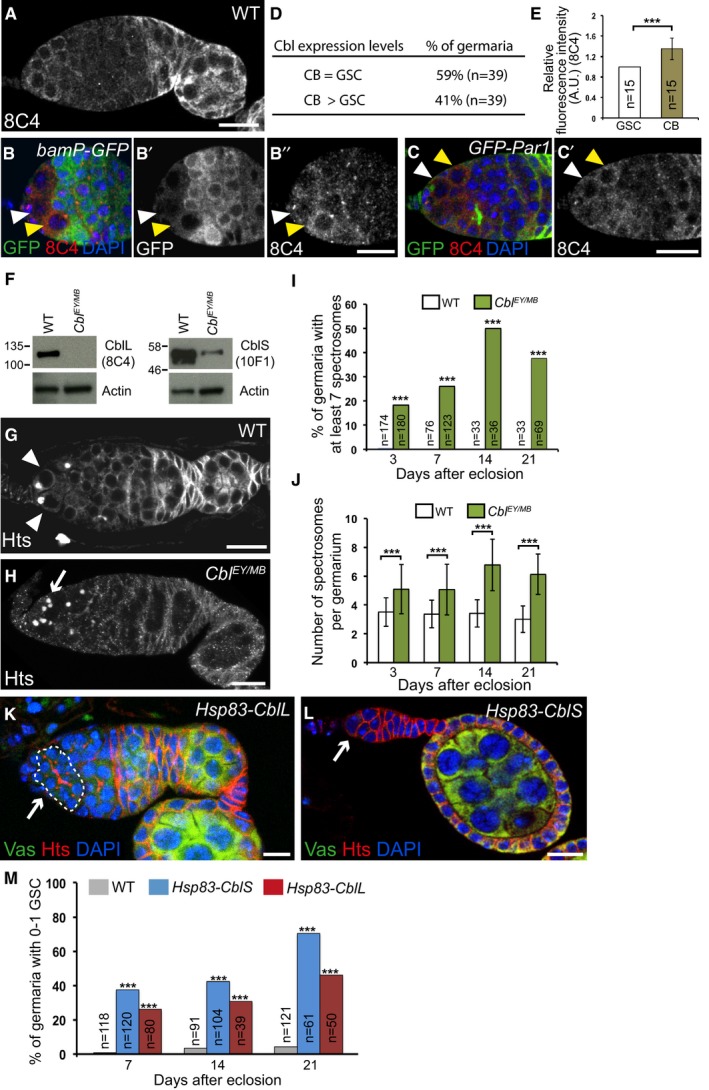
Figure 6. Cbl is required for GSC differentiation.

-
A–ECbl expression in germaria. (A) Immunostaining of wild‐type germaria with anti‐Cbl 8C4. (B–B’’) Immunostaining of bamP‐GFP germaria that express GFP under the bam promoter, with anti‐GFP (green) and anti‐Cbl 8C4 (red). (C–C’) Immunostaining of germaria expressing GFP‐Par1 to label spectrosomes with anti‐GFP (green) and anti‐Cbl 8C4 (red). DAPI (blue) was used to visualize DNA. White arrowheads indicate GSCs; yellow arrowheads indicate cystoblasts. (D) Quantification of germaria showing similar or increased Cbl protein levels in cystoblasts as compared to GSCs. (E) Quantification of increased Cbl protein levels in cystoblasts using fluorescence intensity of immunostaining with 8C4 antibody. Fluorescence intensity was measured in arbitrary units using ImageJ, in germaria showing increased Cbl levels in cystoblasts. The number of scored cells (n) is indicated. Intensity in GSCs was set to 1. The error bar represents standard deviation. ***P‐value < 0.001 using the two‐tailed Student's t‐test.
-
FWestern blots of protein extracts from wild‐type and Cbl mutant ovaries showing CblL (left panel) and CblS (right panel) revealed with 8C4 and 10F1 antibodies, respectively. A low level of CblS remained, while no CblL was present in the Cbl EY11427/MB05683 combination. The 10F1 antibody recognizes very poorly CblL in western blot.
-
G–JCbl is required for germline differentiation. Immunostaining of wild‐type and Cbl EY11427/MB05683 germaria with anti‐Hts to visualize spectrosomes and fusomes. White arrowheads indicate GSCs; the white arrow indicates increased number of spectrosomes. (I) Quantification of germaria with increased number of spectrosomes, and (J) quantification of spectrosomes per germarium. The number of scored germaria (n) is indicated in (I). Error bars represent standard deviation. ***P‐value < 0.001 using the χ2 test in (I), and the two‐tailed Student's t‐test in (J).
-
K–MCbl induces GSC differentiation. Immunostaining of germaria overexpressing Cbl with Hsp83‐CblL (K) or Hsp83‐CblS (L) with anti‐Vasa (green) and anti‐Hts (red). DNA (blue) was revealed with DAPI. White arrows indicate a cyst in the GSC niche (K, outlined) or the loss of GSCs and germ cells (L). (M) Quantification of germaria with 0–1 GSC in the indicated genotypes. The number of scored germaria (n) is indicated. ***P‐value < 0.001 using the χ2 test.
